Note
Click here to download the full example code
Plot - Scatter matrix
from __future__ import absolute_import, division, print_function, unicode_literals

from future import standard_library

from gemseo.api import configure_logger, load_dataset

configure_logger()

standard_library.install_aliases()
Load a dataset
iris = load_dataset("IrisDataset")
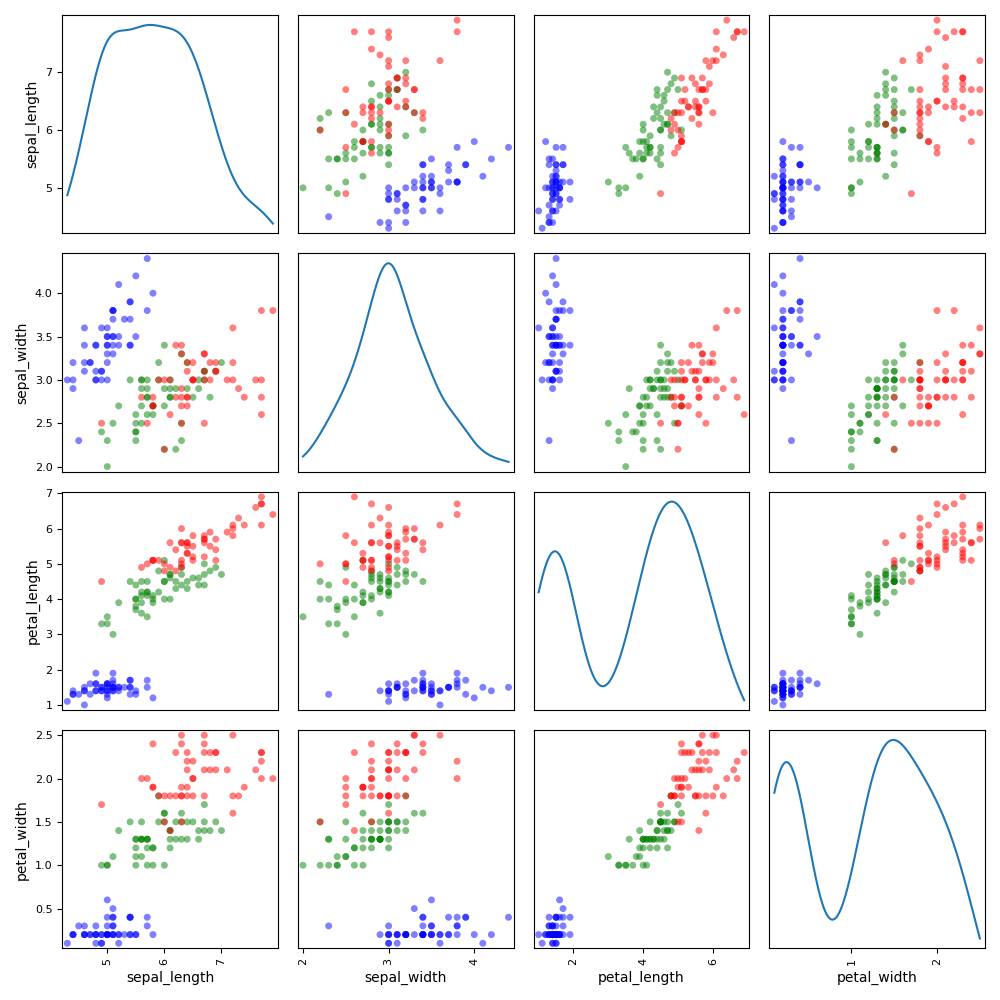
Plot scatter matrix
We can use the ScatterMatrix plot where each non-diagonal block
represents the samples according to the x- and y- coordinates names
while the diagonal ones approximate the probability distributions of the
variables, using either an histogram or a kernel-density estimator.
iris.plot("ScatterMatrix", classifier="specy", kde=True)
Out:
<gemseo.post.dataset.scatter_plot_matrix.ScatterMatrix object at 0x7fc29de4f1f0>
Total running time of the script: ( 0 minutes 0.752 seconds)