Note
Click here to download the full example code
KL-SVD on Burgers equation
Example using KL-SVD on solutions of the Burgers equation.
from __future__ import absolute_import, division, print_function, unicode_literals

from builtins import next, range

import matplotlib.pyplot as plt
from future import standard_library

from gemseo.api import configure_logger
from gemseo.mlearning.transform.dimension_reduction.klsvd import KLSVD
from gemseo.problems.dataset.burgers import BurgersDataset

configure_logger()

standard_library.install_aliases()
Load dataset
dataset = BurgersDataset(n_samples=20)
print(dataset)

t = dataset.get_data_by_group(dataset.INPUT_GROUP)[:, 0]
u_t = dataset.get_data_by_group(dataset.OUTPUT_GROUP)
t_split = 0.87
Out:
Burgers
| Number of samples: 20
| Number of variables: 2
| Variables names and sizes by group:
| - inputs: t (1)
| - outputs: u_t (501)
| Number of dimensions (total = 502) by group:
| - inputs: 1
| - outputs: 501
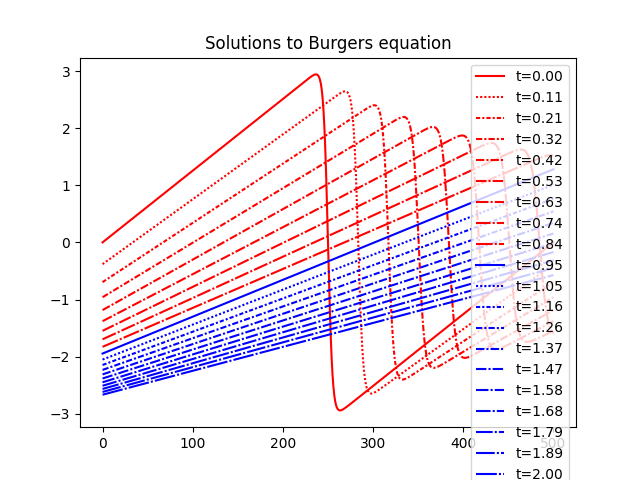
Plot dataset
def lines_gen():
    """ Linestyle generator. """
    yield "-"
    for i in range(1, dataset.n_samples):
        yield 0, (i, 1, 1, 1)


color = "red"
lines = lines_gen()
for i in range(dataset.n_samples):

    # Switch mode if discontinuity is gone
    if color == "red" and t[i] > t_split:
        color = "blue"
        lines = lines_gen()  # reset linestyle generator

    plt.plot(u_t[i], color=color, linestyle=next(lines), label="t={:.2f}".format(t[i]))

plt.legend()
plt.title("Solutions to Burgers equation")
plt.show()
Create KLSVD
n_modes = 7
klsvd = KLSVD(dataset.metadata["x"], n_modes)
klsvd.fit(u_t)
u_t_reduced = klsvd.transform(u_t)
u_t_restored = klsvd.inverse_transform(u_t_reduced)

print("Dimension of the reduced space: {}".format(klsvd.output_dimension))
Out:
Dimension of the reduced space: 7
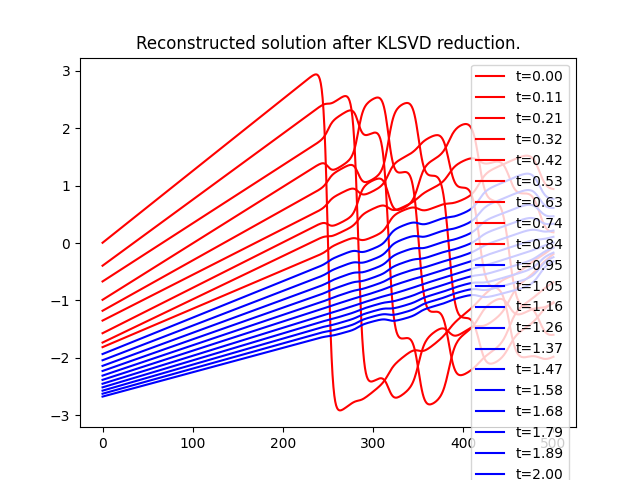
Plot restored data
color = "red"
lines = lines_gen()
for i in range(dataset.n_samples):

    # Switch mode if discontinuity is gone
    if color == "red" and t[i] > t_split:
        color = "blue"
        lines = lines_gen()  # reset linestyle generator

    plt.plot(
        u_t_restored[i],
        color=color,  # linestyle=next(lines),
        label="t={:.2f}".format(t[i]),
    )

plt.legend()
plt.title("Reconstructed solution after KLSVD reduction.")
plt.show()
Total running time of the script: ( 0 minutes 0.708 seconds)