Note
Click here to download the full example code
Scaler example
In this example, we will create a scaler to transform data.
from __future__ import absolute_import, division, print_function, unicode_literals

from builtins import zip

import matplotlib.pyplot as plt
from future import standard_library
from numpy import linspace
from numpy import max as npmax
from numpy import mean
from numpy import min as npmin
from numpy import sin, std

from gemseo.api import configure_logger
from gemseo.mlearning.transform.scaler.min_max_scaler import MinMaxScaler
from gemseo.mlearning.transform.scaler.scaler import Scaler
from gemseo.mlearning.transform.scaler.standard_scaler import StandardScaler

configure_logger()

standard_library.install_aliases()
Create dataset
x = linspace(0, 1, 100)
data = (x < 0.3) * 5 * x + (x > 0.3) * sin(20 * x)
Create transformers
same_scaler = Scaler()
scaler = Scaler(offset=-2, coefficient=0.5)
min_max_scaler = MinMaxScaler()
standard_scaler = StandardScaler()
Transform data
same_data = same_scaler.fit_transform(data)
scaled_data = scaler.fit_transform(data)
min_max_scaled_data = min_max_scaler.fit_transform(data)
standard_scaled_data = standard_scaler.fit_transform(data)
Compute jacobian
jac_same = same_scaler.compute_jacobian(data)
jac_scaled = scaler.compute_jacobian(data)
jac_min_max_scaled = min_max_scaler.compute_jacobian(data)
jac_standard_scaled = standard_scaler.compute_jacobian(data)

print(jac_standard_scaled)
Out:
[[1.42827181 0.         0.         ... 0.         0.         0.        ]
 [0.         1.42827181 0.         ... 0.         0.         0.        ]
 [0.         0.         1.42827181 ... 0.         0.         0.        ]
 ...
 [0.         0.         0.         ... 1.42827181 0.         0.        ]
 [0.         0.         0.         ... 0.         1.42827181 0.        ]
 [0.         0.         0.         ... 0.         0.         1.42827181]]
Print properties
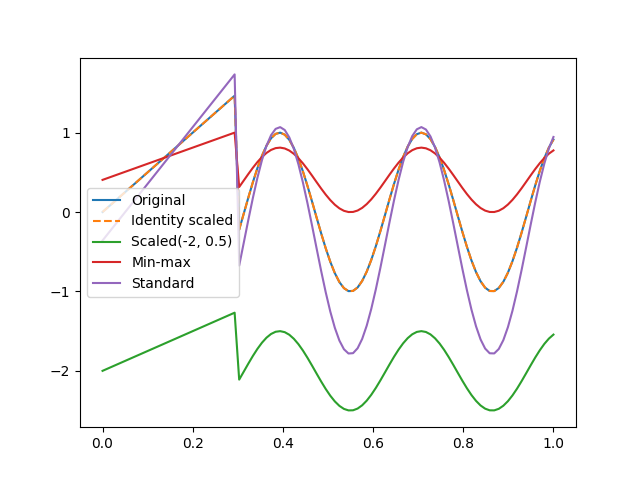
We may print the min, max, mean and standard deviation of the transformed data. This reveals some of the properties of the different scalers: The scaler without arguments has an offset of 0 and a scaling coefficient of 1, which turns this transformer into the identity function. The min-max scaler has a min of 0 and a max of 1. The standard scaler has a mean of zero and a standard deviation of 1.
names = [
    "Original data  ",
    "Same scaler    ",
    "Scaler(-2, 0.5)",
    "Min-max scaler ",
    "Standard scaler",
]
print("{:^18}{:^8}{:^8}{:^8}{:^8}".format("", "min", "max", "mean", "std"))
for name, y in zip(
    names, [data, same_data, scaled_data, min_max_scaled_data, standard_scaled_data]
):
    print(
        "{} : {: .3f}, {: .3f}, {: .3f}, {: .3f}".format(
            name, npmin(y), npmax(y), mean(y), std(y)
        ),
    )
Out:
                    min     max     mean    std
Original data   : -0.996,  1.465,  0.251,  0.700
Same scaler     : -0.996,  1.465,  0.251,  0.700
Scaler(-2, 0.5) : -2.498, -1.268, -1.874,  0.350
Min-max scaler  :  0.000,  1.000,  0.507,  0.285
Standard scaler : -1.782,  1.733,  0.000,  1.000
Plot data
plt.plot(x, data, label="Original")
plt.plot(x, same_data, label="Identity scaled", linestyle="--")
plt.plot(x, scaled_data, label="Scaled(-2, 0.5)")
plt.plot(x, min_max_scaled_data, label="Min-max")
plt.plot(x, standard_scaled_data, label="Standard")
plt.legend()
plt.show()
Total running time of the script: ( 0 minutes 0.114 seconds)