Note
Click here to download the full example code
Robustness
In this example, we illustrate the use of the Robustness plot
on the Sobieski’s SSBJ problem.
from __future__ import absolute_import, division, print_function, unicode_literals

from future import standard_library
Import
The first step is to import some functions from the API and a method to get the design space.
from gemseo.api import configure_logger, create_discipline, create_scenario
from gemseo.problems.sobieski.core import SobieskiProblem

configure_logger()

standard_library.install_aliases()
Create disciplines
Then, we instantiate the disciplines of the Sobieski’s SSBJ problem: Propulsion, Aerodynamics, Structure and Mission
disciplines = create_discipline(
    [
        "SobieskiPropulsion",
        "SobieskiAerodynamics",
        "SobieskiStructure",
        "SobieskiMission",
    ]
)
Create design space
We also read the design space from the SobieskiProblem.
design_space = SobieskiProblem().read_design_space()
Create and execute scenario
The next step is to build a MDO scenario in order to maximize the range, encoded ‘y_4’, with respect to the design parameters, while satisfying the inequality constraints ‘g_1’, ‘g_2’ and ‘g_3’. We can use the MDF formulation, the SLSQP optimization algorithm and a maximum number of iterations equal to 100.
scenario = create_scenario(
    disciplines,
    formulation="MDF",
    objective_name="y_4",
    maximize_objective=True,
    design_space=design_space,
)
scenario.set_differentiation_method("user")
for constraint in ["g_1", "g_2", "g_3"]:
    scenario.add_constraint(constraint, "ineq")
scenario.execute({"algo": "SLSQP", "max_iter": 10})
Out:
{'algo': 'SLSQP', 'max_iter': 10}
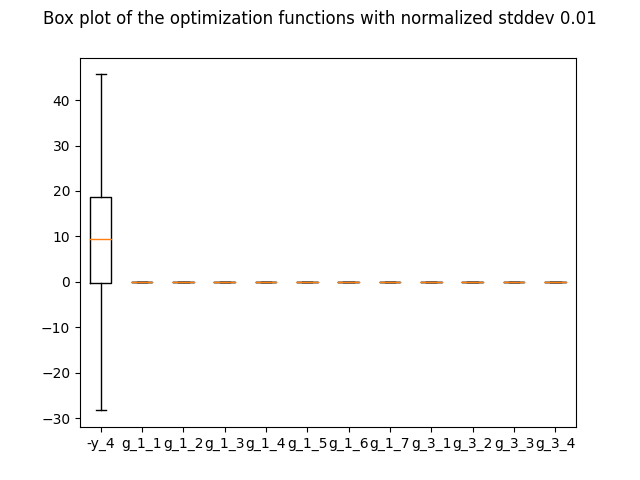
Post-process scenario
Lastly, we post-process the scenario by means of the Robustness
plot which performs a quadratic approximation from an optimization history,
and plot the results as cuts of the approximation computes the quadratic
approximations of all the output functions, propagate analytically a normal
distribution centered on the optimal design variable with a standard
deviation which is a percentage of the mean passed in option (default: 1%)
and plot the corresponding output boxplot. plots any of the constraint or
objective functions w.r.t. optimization iterations or sampling snapshots.
scenario.post_process("Robustness", save=False, show=True)
Out:
<gemseo.post.robustness.Robustness object at 0x7fc298680850>
Total running time of the script: ( 0 minutes 0.610 seconds)