Coupling visualization
First of all, we need to instantiate the different MDODiscipline, e.g.
from gemseo.api import create_discipline

disciplines = create_discipline(['Sellar1', 'Sellar2', 'SellarSystem'])
N2 chart
Then, we can represent the coupling structure of these disciplines by means of a N2 chart,
also referred to as N2 diagram, N-squared diagram or N-squared chart.
See also
More information concerning the N2 chart on wikipedia.
Description
For that, we consider the generate_n2_plot() API function:
from gemseo.api import generate_n2_plot

generate_n2_plot(disciplines)
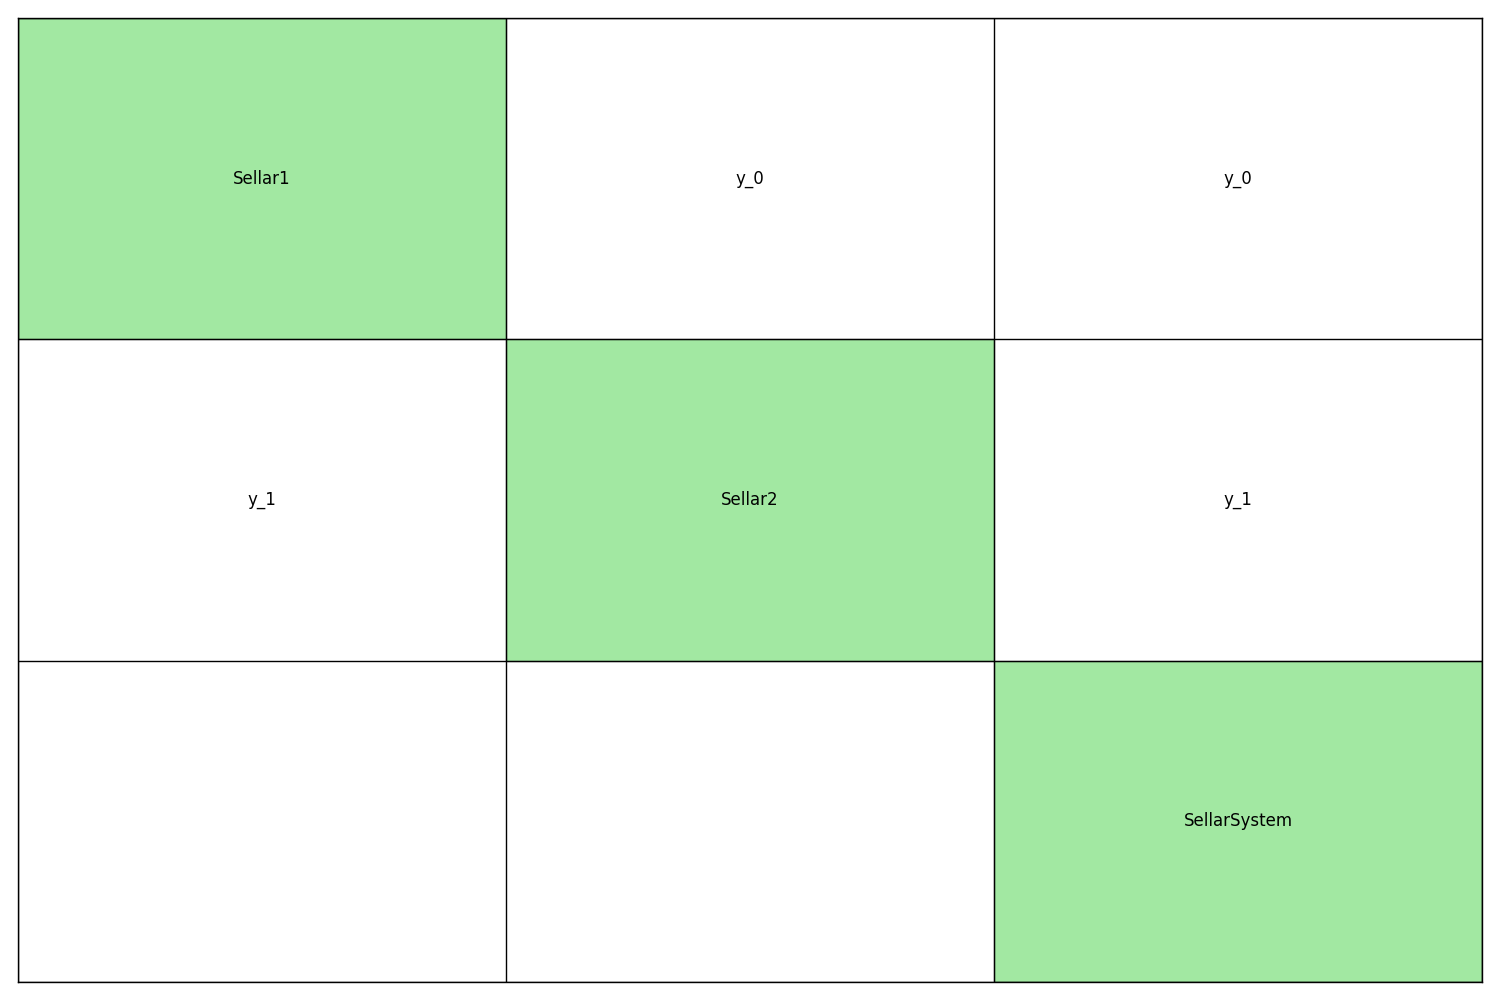
and obtains the following N2 chart where:
disciplines are on the diagonal,
the input coupling variables of a discipline are located at the vertical of the discipline,
the output coupling variables of a discipline are located at the horizontal of the discipline.
In this case, Sellar1 returns the coupling variable y_0 which is an input for Sellar2 and SellarSystem. Similarly, Sellar2 returns the coupling variable y_1 which is an input for Sellar1 and SellarSystem.
Options
The first argument of the generate_n2_plot() API function is the list of MDODiscipline.
This argument is mandatory while the others are optional:
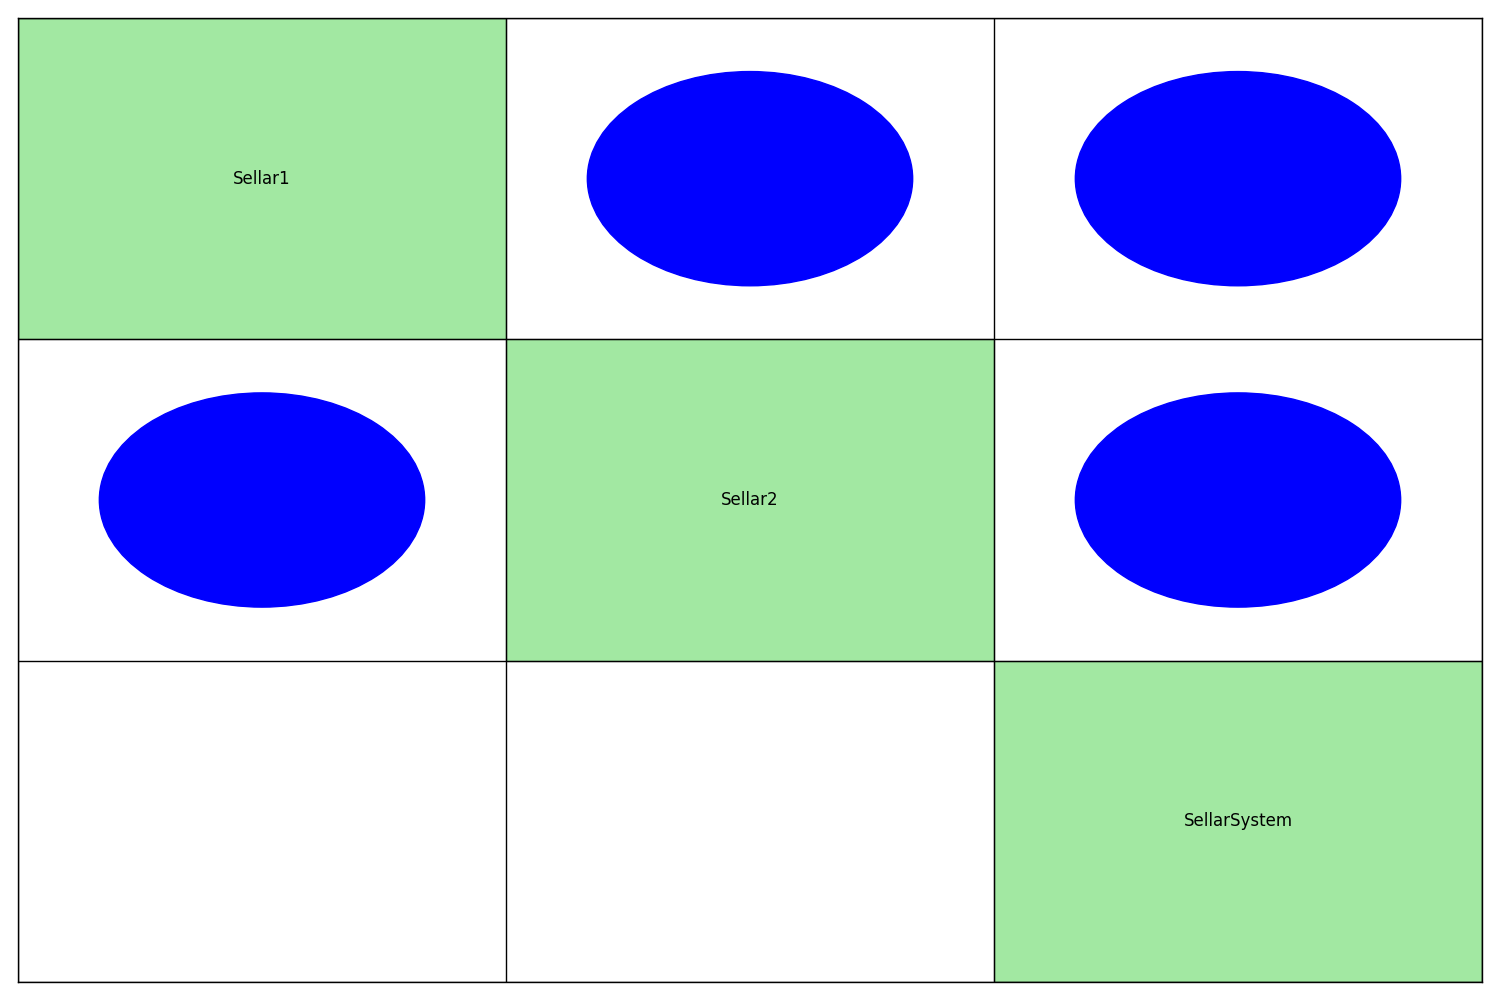
file_path: file path of the figure (default value:'n2.pdf')show_data_names: if true, the names of the coupling data is shown otherwise, circles are drawn, which sizes depend on the number of coupling names (default value:True)save: if True, saved the figure to file_path (default value:True)show: if True, shows the plot (default value:False)figsize: tuple, size of the figure (default value:(15,10))
Here, when show_data_names is False, we obtain:
Coupling graph
We can also represent this relation by means of a coupling graph.
Description
For that, we consider the generate_coupling_graph() API function:
from gemseo.api import generate_coupling_graph

generate_coupling_graph(disciplines)
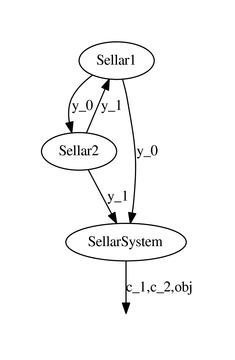
and obtains the following coupling graph where:
disciplines are represented by bubbles,
coupling variable flows are represented by arrows between disciplines,
constraint and objectives functions are represented.
In this case, the coupling variable y_0 goes from Sellar1 to Sellar2 and from Sellar1 to SellarSystem. Similarly, the coupling variable y_1 goes from Sellar2 to Sellar1 and from Sellar2 to SellarSystem. Moreover, SellarSystem returns the value of the objective function and constraints.
Options
The first argument of the generate_coupling_graph() API function is the list of MDODiscipline.
This argument is mandatory while the other is optional:
file_path: file path of the figure (default value:'coupling_graph.pdf')