Note
Click here to download the full example code
Burgers dataset
Dataset consisting of solutions to Burgers’ equation.
from __future__ import division, unicode_literals

from matplotlib import pyplot as plt

from gemseo.api import configure_logger, load_dataset

configure_logger()
Out:
<RootLogger root (INFO)>
Load Burgers’ dataset
We can easily load this dataset by means of the
load_dataset() function of the API:
dataset = load_dataset("BurgersDataset")
print(dataset)
Out:
Burgers
   Number of samples: 30
   Number of variables: 2
   Variables names and sizes by group:
      inputs: t (1)
      outputs: u_t (501)
   Number of dimensions (total = 502) by group:
      inputs: 1
      outputs: 501
Show the input and output data
print(dataset.get_data_by_group("inputs"))
print(dataset.get_data_by_group("outputs"))
Out:
[[0.        ]
 [0.06896552]
 [0.13793103]
 [0.20689655]
 [0.27586207]
 [0.34482759]
 [0.4137931 ]
 [0.48275862]
 [0.55172414]
 [0.62068966]
 [0.68965517]
 [0.75862069]
 [0.82758621]
 [0.89655172]
 [0.96551724]
 [1.03448276]
 [1.10344828]
 [1.17241379]
 [1.24137931]
 [1.31034483]
 [1.37931034]
 [1.44827586]
 [1.51724138]
 [1.5862069 ]
 [1.65517241]
 [1.72413793]
 [1.79310345]
 [1.86206897]
 [1.93103448]
 [2.        ]]
[[-8.61058323e-43  1.25663706e-02  2.51327412e-02 ... -2.51327412e-02
  -1.25663706e-02  8.61058323e-43]
 [-2.58064516e-01 -2.46308879e-01 -2.34553242e-01 ... -2.81575790e-01
  -2.69820153e-01 -2.58064516e-01]
 [-4.84848485e-01 -4.73805311e-01 -4.62762136e-01 ... -5.06934833e-01
  -4.95891659e-01 -4.84848485e-01]
 ...
 [-2.60240964e+00 -2.59801898e+00 -2.59362832e+00 ... -4.15861152e-01
  -4.11470492e-01 -4.07079832e-01]
 [-2.63529412e+00 -2.63100677e+00 -2.62671942e+00 ... -5.00193830e-01
  -4.95906480e-01 -4.91619130e-01]
 [-2.66666667e+00 -2.66247788e+00 -2.65828909e+00 ... -5.80649145e-01
  -5.76460354e-01 -5.72271564e-01]]
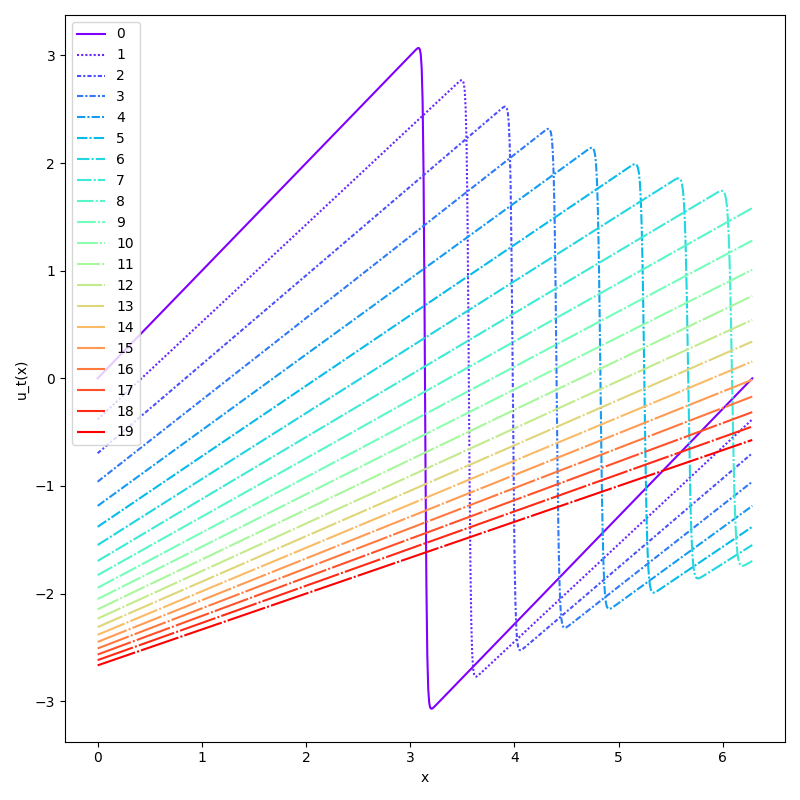
Load customized dataset
Load the data with custom parameters and input-output naming.
dataset = load_dataset("BurgersDataset", n_samples=20, n_x=700, fluid_viscosity=0.03)
print(dataset)
Out:
Burgers
   Number of samples: 20
   Number of variables: 2
   Variables names and sizes by group:
      inputs: t (1)
      outputs: u_t (700)
   Number of dimensions (total = 701) by group:
      inputs: 1
      outputs: 700
Plot the data
dataset.plot("Curves", mesh="x", variable="u_t", show=False, save=False)
# Workaround for HTML rendering, instead of ``show=True``
plt.show()
Total running time of the script: ( 0 minutes 0.568 seconds)