Note
Click here to download the full example code
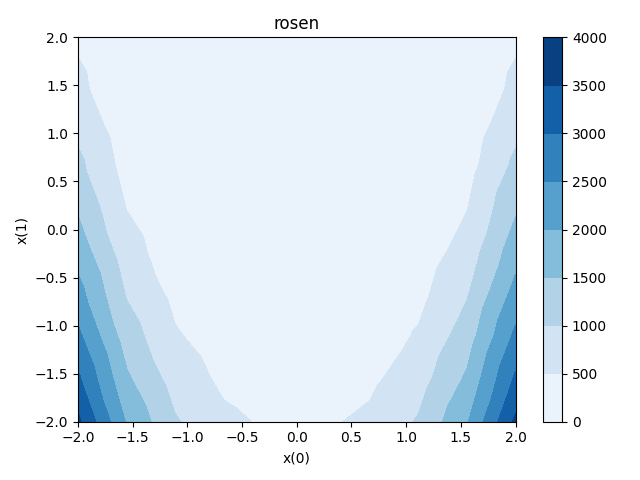
Rosenbrock dataset
This Dataset contains 100 evaluations
of the well-known Rosenbrock function:
\[f(x,y)=(1-x)^2+100(y-x^2)^2\]
This function is known for its global minimum at point (1,1), its banana valley and the difficulty to reach its minimum.
This Dataset is based on a full-factorial
design of experiments.
More information about the Rosenbrock function
from __future__ import division, unicode_literals

from matplotlib import pyplot as plt

from gemseo.api import configure_logger, load_dataset

configure_logger()
Out:
<RootLogger root (INFO)>
Load Rosenbrock dataset
We can easily load this dataset by means of the
load_dataset() function of the API:
dataset = load_dataset("RosenbrockDataset")
print(dataset)
Out:
Rosenbrock
   Number of samples: 100
   Number of variables: 2
   Variables names and sizes by group:
      design_parameters: x (2)
      functions: rosen (1)
   Number of dimensions (total = 3) by group:
      design_parameters: 2
      functions: 1
Show the input and output data
print(dataset.get_data_by_group("design_parameters"))
print(dataset.get_data_by_group("functions"))
Out:
[[-2.         -2.        ]
 [-1.55555556 -2.        ]
 [-1.11111111 -2.        ]
 [-0.66666667 -2.        ]
 [-0.22222222 -2.        ]
 [ 0.22222222 -2.        ]
 [ 0.66666667 -2.        ]
 [ 1.11111111 -2.        ]
 [ 1.55555556 -2.        ]
 [ 2.         -2.        ]
 [-2.         -1.55555556]
 [-1.55555556 -1.55555556]
 [-1.11111111 -1.55555556]
 [-0.66666667 -1.55555556]
 [-0.22222222 -1.55555556]
 [ 0.22222222 -1.55555556]
 [ 0.66666667 -1.55555556]
 [ 1.11111111 -1.55555556]
 [ 1.55555556 -1.55555556]
 [ 2.         -1.55555556]
 [-2.         -1.11111111]
 [-1.55555556 -1.11111111]
 [-1.11111111 -1.11111111]
 [-0.66666667 -1.11111111]
 [-0.22222222 -1.11111111]
 [ 0.22222222 -1.11111111]
 [ 0.66666667 -1.11111111]
 [ 1.11111111 -1.11111111]
 [ 1.55555556 -1.11111111]
 [ 2.         -1.11111111]
 [-2.         -0.66666667]
 [-1.55555556 -0.66666667]
 [-1.11111111 -0.66666667]
 [-0.66666667 -0.66666667]
 [-0.22222222 -0.66666667]
 [ 0.22222222 -0.66666667]
 [ 0.66666667 -0.66666667]
 [ 1.11111111 -0.66666667]
 [ 1.55555556 -0.66666667]
 [ 2.         -0.66666667]
 [-2.         -0.22222222]
 [-1.55555556 -0.22222222]
 [-1.11111111 -0.22222222]
 [-0.66666667 -0.22222222]
 [-0.22222222 -0.22222222]
 [ 0.22222222 -0.22222222]
 [ 0.66666667 -0.22222222]
 [ 1.11111111 -0.22222222]
 [ 1.55555556 -0.22222222]
 [ 2.         -0.22222222]
 [-2.          0.22222222]
 [-1.55555556  0.22222222]
 [-1.11111111  0.22222222]
 [-0.66666667  0.22222222]
 [-0.22222222  0.22222222]
 [ 0.22222222  0.22222222]
 [ 0.66666667  0.22222222]
 [ 1.11111111  0.22222222]
 [ 1.55555556  0.22222222]
 [ 2.          0.22222222]
 [-2.          0.66666667]
 [-1.55555556  0.66666667]
 [-1.11111111  0.66666667]
 [-0.66666667  0.66666667]
 [-0.22222222  0.66666667]
 [ 0.22222222  0.66666667]
 [ 0.66666667  0.66666667]
 [ 1.11111111  0.66666667]
 [ 1.55555556  0.66666667]
 [ 2.          0.66666667]
 [-2.          1.11111111]
 [-1.55555556  1.11111111]
 [-1.11111111  1.11111111]
 [-0.66666667  1.11111111]
 [-0.22222222  1.11111111]
 [ 0.22222222  1.11111111]
 [ 0.66666667  1.11111111]
 [ 1.11111111  1.11111111]
 [ 1.55555556  1.11111111]
 [ 2.          1.11111111]
 [-2.          1.55555556]
 [-1.55555556  1.55555556]
 [-1.11111111  1.55555556]
 [-0.66666667  1.55555556]
 [-0.22222222  1.55555556]
 [ 0.22222222  1.55555556]
 [ 0.66666667  1.55555556]
 [ 1.11111111  1.55555556]
 [ 1.55555556  1.55555556]
 [ 2.          1.55555556]
 [-2.          2.        ]
 [-1.55555556  2.        ]
 [-1.11111111  2.        ]
 [-0.66666667  2.        ]
 [-0.22222222  2.        ]
 [ 0.22222222  2.        ]
 [ 0.66666667  2.        ]
 [ 1.11111111  2.        ]
 [ 1.55555556  2.        ]
 [ 2.          2.        ]]
[[3.60900000e+03]
 [1.95995260e+03]
 [1.05069974e+03]
 [6.00308642e+02]
 [4.21490779e+02]
 [4.20601890e+02]
 [5.97641975e+02]
 [1.04625530e+03]
 [1.95373038e+03]
 [3.60100000e+03]
 [3.09541975e+03]
 [1.58683874e+03]
 [7.82935681e+02]
 [4.02777778e+02]
 [2.59076513e+02]
 [2.58187624e+02]
 [4.00111111e+02]
 [7.78491236e+02]
 [1.58061652e+03]
 [3.08741975e+03]
 [2.62134568e+03]
 [1.25323106e+03]
 [5.54677793e+02]
 [2.44753086e+02]
 [1.36168419e+02]
 [1.35279531e+02]
 [2.42086420e+02]
 [5.50233349e+02]
 [1.24700884e+03]
 [2.61334568e+03]
 [2.18677778e+03]
 [9.59129553e+02]
 [3.65926078e+02]
 [1.26234568e+02]
 [5.27664990e+01]
 [5.18776101e+01]
 [1.23567901e+02]
 [3.61481634e+02]
 [9.52907331e+02]
 [2.17877778e+03]
 [1.79171605e+03]
 [7.04534217e+02]
 [2.16680537e+02]
 [4.72222222e+01]
 [8.87075141e+00]
 [7.98186252e+00]
 [4.45555556e+01]
 [2.12236092e+02]
 [6.98311995e+02]
 [1.78371605e+03]
 [1.43616049e+03]
 [4.89445054e+02]
 [1.06941168e+02]
 [7.71604938e+00]
 [4.48117665e+00]
 [3.59228776e+00]
 [5.04938272e+00]
 [1.02496723e+02]
 [4.83222832e+02]
 [1.42816049e+03]
 [1.12011111e+03]
 [3.13862064e+02]
 [3.67079713e+01]
 [7.71604938e+00]
 [3.95977747e+01]
 [3.87088858e+01]
 [5.04938272e+00]
 [3.22635269e+01]
 [3.07639841e+02]
 [1.11211111e+03]
 [8.43567901e+02]
 [1.77785246e+02]
 [5.98094803e+00]
 [4.72222222e+01]
 [1.14220546e+02]
 [1.13331657e+02]
 [4.45555556e+01]
 [1.53650358e+00]
 [1.71563024e+02]
 [8.35567901e+02]
 [6.06530864e+02]
 [8.12146014e+01]
 [1.47600975e+01]
 [1.26234568e+02]
 [2.28349489e+02]
 [2.27460601e+02]
 [1.23567901e+02]
 [1.03156531e+01]
 [7.49923792e+01]
 [5.98530864e+02]
 [4.09000000e+02]
 [2.41501296e+01]
 [6.30454199e+01]
 [2.44753086e+02]
 [3.81984606e+02]
 [3.81095717e+02]
 [2.42086420e+02]
 [5.86009755e+01]
 [1.79279073e+01]
 [4.01000000e+02]]
Load the data with an input-output naming
dataset = load_dataset("RosenbrockDataset", opt_naming=False)
print(dataset)
Out:
Rosenbrock
   Number of samples: 100
   Number of variables: 2
   Variables names and sizes by group:
      inputs: x (2)
      outputs: rosen (1)
   Number of dimensions (total = 3) by group:
      inputs: 2
      outputs: 1
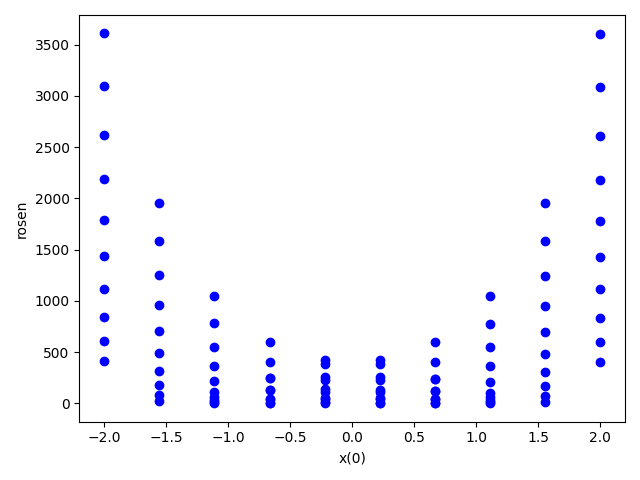
Plot the data
dataset.plot("ZvsXY", x="x", x_comp=0, y="x", y_comp=1, z="rosen", show=False)

dataset.plot("YvsX", x="x", x_comp=0, y="rosen", show=False)
# Workaround for HTML rendering, instead of ``show=True``
plt.show()
Total running time of the script: ( 0 minutes 0.553 seconds)