Note
Click here to download the full example code
Scaler example
In this example, we will create a scaler to transform data.
from __future__ import division, unicode_literals

import matplotlib.pyplot as plt
from numpy import linspace
from numpy import max as npmax
from numpy import mean
from numpy import min as npmin
from numpy import sin, std

from gemseo.api import configure_logger
from gemseo.mlearning.transform.scaler.min_max_scaler import MinMaxScaler
from gemseo.mlearning.transform.scaler.scaler import Scaler
from gemseo.mlearning.transform.scaler.standard_scaler import StandardScaler

configure_logger()
Out:
<RootLogger root (INFO)>
Create dataset
x = linspace(0, 1, 100)
data = (x < 0.3) * 5 * x + (x > 0.3) * sin(20 * x)
Create transformers
same_scaler = Scaler()
scaler = Scaler(offset=-2, coefficient=0.5)
min_max_scaler = MinMaxScaler()
standard_scaler = StandardScaler()
Transform data
same_data = same_scaler.fit_transform(data)
scaled_data = scaler.fit_transform(data)
min_max_scaled_data = min_max_scaler.fit_transform(data)
standard_scaled_data = standard_scaler.fit_transform(data)
Out:
WARNING - 09:23:29: The Scaler.fit() function does nothing; the instance of Scaler uses the coefficient and offset passed at its initialization
WARNING - 09:23:29: The Scaler.fit() function does nothing; the instance of Scaler uses the coefficient and offset passed at its initialization
Compute jacobian
jac_same = same_scaler.compute_jacobian(data)
jac_scaled = scaler.compute_jacobian(data)
jac_min_max_scaled = min_max_scaler.compute_jacobian(data)
jac_standard_scaled = standard_scaler.compute_jacobian(data)

print(jac_standard_scaled)
Out:
[[1.42827181 0.         0.         ... 0.         0.         0.        ]
 [0.         1.42827181 0.         ... 0.         0.         0.        ]
 [0.         0.         1.42827181 ... 0.         0.         0.        ]
 ...
 [0.         0.         0.         ... 1.42827181 0.         0.        ]
 [0.         0.         0.         ... 0.         1.42827181 0.        ]
 [0.         0.         0.         ... 0.         0.         1.42827181]]
Print properties
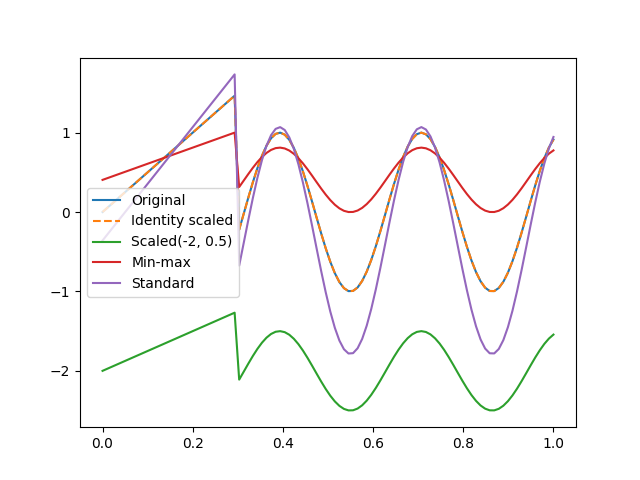
We may print the min, max, mean and standard deviation of the transformed data. This reveals some of the properties of the different scalers: The scaler without arguments has an offset of 0 and a scaling coefficient of 1, which turns this transformer into the identity function. The min-max scaler has a min of 0 and a max of 1. The standard scaler has a mean of zero and a standard deviation of 1.
names = [
    "Original data  ",
    "Same scaler    ",
    "Scaler(-2, 0.5)",
    "Min-max scaler ",
    "Standard scaler",
]
print("{:^18}{:^8}{:^8}{:^8}{:^8}".format("", "min", "max", "mean", "std"))
for name, y in zip(
    names, [data, same_data, scaled_data, min_max_scaled_data, standard_scaled_data]
):
    print(
        "{} : {: .3f}, {: .3f}, {: .3f}, {: .3f}".format(
            name, npmin(y), npmax(y), mean(y), std(y)
        ),
    )
Out:
                    min     max     mean    std
Original data   : -0.996,  1.465,  0.251,  0.700
Same scaler     : -0.996,  1.465,  0.251,  0.700
Scaler(-2, 0.5) : -2.498, -1.268, -1.874,  0.350
Min-max scaler  :  0.000,  1.000,  0.507,  0.285
Standard scaler : -1.782,  1.733,  0.000,  1.000
Plot data
plt.plot(x, data, label="Original")
plt.plot(x, same_data, label="Identity scaled", linestyle="--")
plt.plot(x, scaled_data, label="Scaled(-2, 0.5)")
plt.plot(x, min_max_scaled_data, label="Min-max")
plt.plot(x, standard_scaled_data, label="Standard")
plt.legend()
plt.show()
Total running time of the script: ( 0 minutes 0.170 seconds)