Note
Click here to download the full example code
Plot - Andrews curves
from __future__ import division, unicode_literals

from matplotlib import pyplot as plt

from gemseo.api import configure_logger, load_dataset

configure_logger()
Out:
<RootLogger root (INFO)>
Load a dataset
iris = load_dataset("IrisDataset")
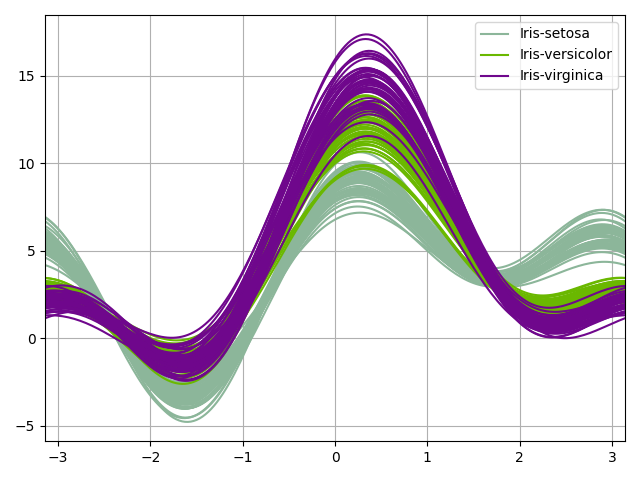
Plot Andrews Curves
We can use the AndrewsCurves plot
which can be viewed as a smooth
version of the parallel coordinates. Each sample is represented by a curve
and if there is structure in data, it may be visible in the plot.
iris.plot("AndrewsCurves", classifier="specy", show=False)
# Workaround for HTML rendering, instead of ``show=True``
plt.show()
Total running time of the script: ( 0 minutes 0.406 seconds)