coupling_study_analysis module
A coupling study analysis generating an N2 from an Excel specification.
- class gemseo.utils.study_analyses.coupling_study_analysis.CouplingStudyAnalysis(xls_study_path)[source]
Bases:
objectA coupling study analysis from an Excel specification.
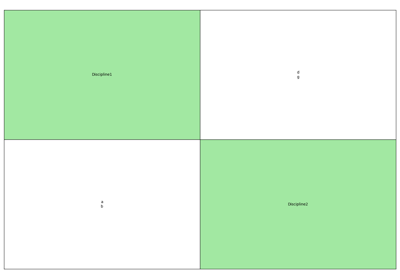
Based on an Excel file defining disciplines in terms of input and output names, this analysis generates an N2 (equivalent to the Design Structure Matrix) diagram, showing the couplings between the disciplines.
The Excel file shall contain one sheet per discipline:
the name of the sheet shall have the discipline name,
the sheet shall define the input names of the discipline as a vertical succession of cells starting with
Inputs:Inputs¶ Inputs
input_name_1
…
input_name_N
the sheet shall define the output names of the discipline as a vertical succession of cells starting with
Outputs:
Outputs¶ Outputs
output_name_1
…
output_name_N
the empty lines of the series
InputsandOutputsare ignored,the sheet may contain other data, but these will not be taken into account.
- Parameters:
xls_study_path (str) – The path to the Excel file describing the study.
- generate_coupling_graph(file_path='coupling_graph.pdf', full=True)[source]
Generate the coupling graph based on the disciplines.
- generate_n2(file_path='n2.pdf', show_data_names=True, save=True, show=False, fig_size=(15, 10), show_html=False)[source]
Generate the N2 based on the disciplines.
- Parameters:
file_path (str | Path) –
The file path to save the static N2 chart.
By default it is set to “n2.pdf”.
show_data_names (bool) –
Whether to show the names of the coupling variables between two disciplines; otherwise, circles are drawn, whose size depends on the number of coupling names.
By default it is set to True.
save (bool) –
Whether to save the static N2 chart.
By default it is set to True.
show (bool) –
Whether to show the static N2 chart.
By default it is set to False.
fig_size (FigSizeType) –
The width and height of the static N2 chart.
By default it is set to (15, 10).
show_html (bool) –
Whether to display the interactive N2 chart in a web browser.
By default it is set to False.
- Return type:
None
- disciplines: dict[str, MDODiscipline]
The disciplines.
- study: XLSStudyParser
The XLSStudyParser instance built from the Excel file.
Examples using CouplingStudyAnalysis
Generate N2 and XDSM diagrams from an Excel description of the MDO problem

Generate an N2 from an Excel description of the coupling problem