Note
Go to the end to download the full example code
Parallel coordinates
from __future__ import annotations

from gemseo import configure_logger
from gemseo import create_benchmark_dataset
from gemseo.post.dataset.parallel_coordinates import ParallelCoordinates

configure_logger()
<RootLogger root (INFO)>
Load a dataset
iris = create_benchmark_dataset("IrisDataset")
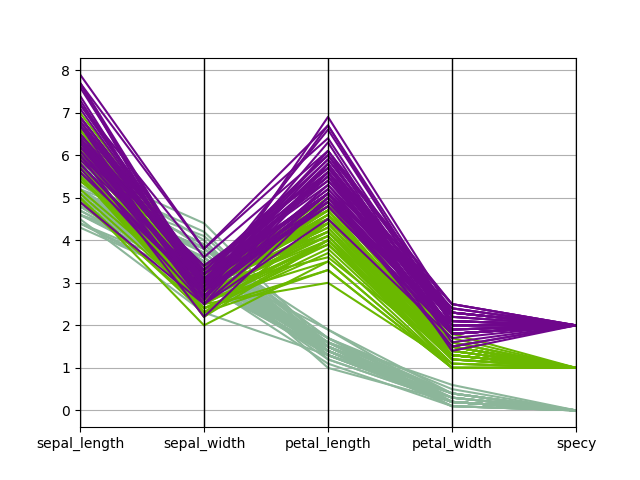
Plot parallel coordinates
We can use the
ParallelCoordinates plot,
a.k.a. cowebplot, where each samples is represented by a continuous straight
line in pieces whose nodes are indexed by the variables names and measure the
variables values.
ParallelCoordinates(iris, classifier="specy").execute(save=False, show=True)
[<Figure size 640x480 with 1 Axes>]
Total running time of the script: (0 minutes 0.296 seconds)