Note
Go to the end to download the full example code
Radar chart
from __future__ import annotations

from numpy import array

from gemseo import configure_logger
from gemseo.datasets.dataset import Dataset
from gemseo.post.dataset.radar_chart import RadarChart

configure_logger()
<RootLogger root (INFO)>
Build a dataset
Let us consider two series of values for the variables x1, x2 and x3
which we arrange in rows in a Dataset:
dataset = Dataset()
dataset.add_variable("x1", array([[0.2, 0.4, 0.5], [0.1, 0.3, 0.5]]))
dataset.add_variable("x2", array([[0.6], [0.5]]))
dataset.add_variable("x3", array([[0.8], [0.7]]))
dataset.index = ["series_1", "series_2"]
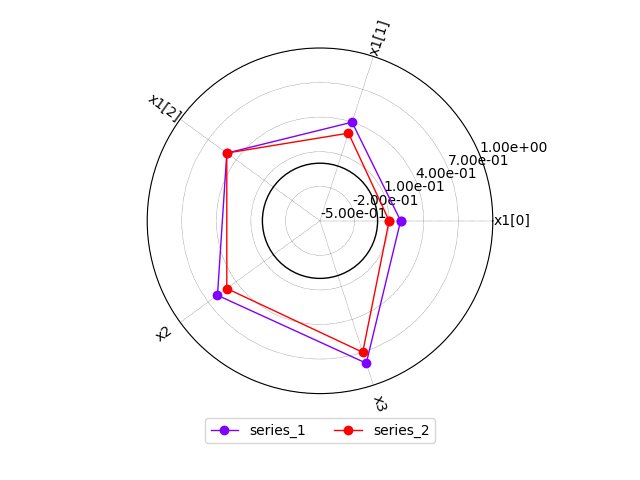
Plot the two series on a radar chart
We can use a RadarChart to display these series,
with one color per series and the values grouped by variable name:
plot = RadarChart(dataset, connect=True, radial_ticks=True)
plot.rmin = -0.5
plot.rmax = 1.0
plot.execute(save=False, show=True)
[<Figure size 640x480 with 1 Axes>]
Total running time of the script: (0 minutes 0.114 seconds)