Note
Go to the end to download the full example code
Simple disciplinary DOE example on the Sobieski SSBJ test case
from __future__ import annotations

from gemseo import configure_logger
from gemseo import create_discipline
from gemseo import create_scenario
from gemseo.problems.mdo.sobieski.core.design_space import SobieskiDesignSpace

configure_logger()
<RootLogger root (INFO)>
Instantiate the discipline
discipline = create_discipline("SobieskiMission")
Create the design space
design_space = SobieskiDesignSpace()
design_space.filter(["y_24", "y_34"])
Create the scenario
Build scenario which links the disciplines with the formulation and The DOE algorithm.
scenario = create_scenario(
    [discipline],
    "DisciplinaryOpt",
    "y_4",
    design_space,
    maximize_objective=True,
    scenario_type="DOE",
)
Execute the scenario
Here we use a latin hypercube sampling algorithm with 30 samples.
scenario.execute({"n_samples": 30, "algo": "lhs"})
    INFO - 08:57:32:
    INFO - 08:57:32: *** Start DOEScenario execution ***
    INFO - 08:57:32: DOEScenario
    INFO - 08:57:32:    Disciplines: SobieskiMission
    INFO - 08:57:32:    MDO formulation: DisciplinaryOpt
    INFO - 08:57:32: Optimization problem:
    INFO - 08:57:32:    minimize -y_4(y_24, y_34)
    INFO - 08:57:32:    with respect to y_24, y_34
    INFO - 08:57:32:    over the design space:
    INFO - 08:57:32:       +------+-------------+------------+-------------+-------+
    INFO - 08:57:32:       | Name | Lower bound |   Value    | Upper bound | Type  |
    INFO - 08:57:32:       +------+-------------+------------+-------------+-------+
    INFO - 08:57:32:       | y_24 |     0.44    | 4.15006276 |    11.13    | float |
    INFO - 08:57:32:       | y_34 |     0.44    | 1.10754577 |     1.98    | float |
    INFO - 08:57:32:       +------+-------------+------------+-------------+-------+
    INFO - 08:57:32: Solving optimization problem with algorithm lhs:
    INFO - 08:57:32:      3%|▎         | 1/30 [00:00<00:00, 337.05 it/sec, obj=-1.53e+3]
    INFO - 08:57:32:      7%|▋         | 2/30 [00:00<00:00, 547.38 it/sec, obj=-1.66e+3]
    INFO - 08:57:32:     10%|█         | 3/30 [00:00<00:00, 705.24 it/sec, obj=-832]
    INFO - 08:57:32:     13%|█▎        | 4/30 [00:00<00:00, 829.24 it/sec, obj=-1.62e+3]
    INFO - 08:57:32:     17%|█▋        | 5/30 [00:00<00:00, 927.66 it/sec, obj=-994]
    INFO - 08:57:32:     20%|██        | 6/30 [00:00<00:00, 1007.56 it/sec, obj=-601]
    INFO - 08:57:32:     23%|██▎       | 7/30 [00:00<00:00, 1074.24 it/sec, obj=-180]
    INFO - 08:57:32:     27%|██▋       | 8/30 [00:00<00:00, 1130.50 it/sec, obj=-755]
    INFO - 08:57:32:     30%|███       | 9/30 [00:00<00:00, 1173.12 it/sec, obj=-691]
    INFO - 08:57:32:     33%|███▎      | 10/30 [00:00<00:00, 1211.25 it/sec, obj=-393]
    INFO - 08:57:32:     37%|███▋      | 11/30 [00:00<00:00, 1247.56 it/sec, obj=-362]
    INFO - 08:57:32:     40%|████      | 12/30 [00:00<00:00, 1279.27 it/sec, obj=-748]
    INFO - 08:57:32:     43%|████▎     | 13/30 [00:00<00:00, 1307.55 it/sec, obj=-719]
    INFO - 08:57:32:     47%|████▋     | 14/30 [00:00<00:00, 1332.73 it/sec, obj=-293]
    INFO - 08:57:32:     50%|█████     | 15/30 [00:00<00:00, 1355.51 it/sec, obj=-931]
    INFO - 08:57:32:     53%|█████▎    | 16/30 [00:00<00:00, 1370.97 it/sec, obj=-264]
    INFO - 08:57:32:     57%|█████▋    | 17/30 [00:00<00:00, 1386.82 it/sec, obj=-1.17e+3]
    INFO - 08:57:32:     60%|██████    | 18/30 [00:00<00:00, 1403.43 it/sec, obj=-495]
    INFO - 08:57:32:     63%|██████▎   | 19/30 [00:00<00:00, 1419.19 it/sec, obj=-189]
    INFO - 08:57:32:     67%|██████▋   | 20/30 [00:00<00:00, 1433.46 it/sec, obj=-2.23e+3]
    INFO - 08:57:32:     70%|███████   | 21/30 [00:00<00:00, 1446.45 it/sec, obj=-344]
    INFO - 08:57:32:     73%|███████▎  | 22/30 [00:00<00:00, 1458.84 it/sec, obj=-799]
    INFO - 08:57:32:     77%|███████▋  | 23/30 [00:00<00:00, 1467.43 it/sec, obj=-55.9]
    INFO - 08:57:32:     80%|████████  | 24/30 [00:00<00:00, 1476.52 it/sec, obj=-123]
    INFO - 08:57:32:     83%|████████▎ | 25/30 [00:00<00:00, 1486.75 it/sec, obj=-875]
    INFO - 08:57:32:     87%|████████▋ | 26/30 [00:00<00:00, 1496.53 it/sec, obj=-726]
    INFO - 08:57:32:     90%|█████████ | 27/30 [00:00<00:00, 1505.39 it/sec, obj=-69.6]
    INFO - 08:57:32:     93%|█████████▎| 28/30 [00:00<00:00, 1513.56 it/sec, obj=-1.51e+3]
    INFO - 08:57:32:     97%|█████████▋| 29/30 [00:00<00:00, 1521.16 it/sec, obj=-1.15e+3]
    INFO - 08:57:32:    100%|██████████| 30/30 [00:00<00:00, 1525.96 it/sec, obj=-2.73e+3]
    INFO - 08:57:32: Optimization result:
    INFO - 08:57:32:    Optimizer info:
    INFO - 08:57:32:       Status: None
    INFO - 08:57:32:       Message: None
    INFO - 08:57:32:       Number of calls to the objective function by the optimizer: 30
    INFO - 08:57:32:    Solution:
    INFO - 08:57:32:       Objective: -2726.3660548732214
    INFO - 08:57:32:       Design space:
    INFO - 08:57:32:          +------+-------------+--------------------+-------------+-------+
    INFO - 08:57:32:          | Name | Lower bound |       Value        | Upper bound | Type  |
    INFO - 08:57:32:          +------+-------------+--------------------+-------------+-------+
    INFO - 08:57:32:          | y_24 |     0.44    | 9.094543945649603  |    11.13    | float |
    INFO - 08:57:32:          | y_34 |     0.44    | 0.4769766573300308 |     1.98    | float |
    INFO - 08:57:32:          +------+-------------+--------------------+-------------+-------+
    INFO - 08:57:32: *** End DOEScenario execution (time: 0:00:00.031018) ***

{'eval_jac': False, 'n_samples': 30, 'algo': 'lhs'}
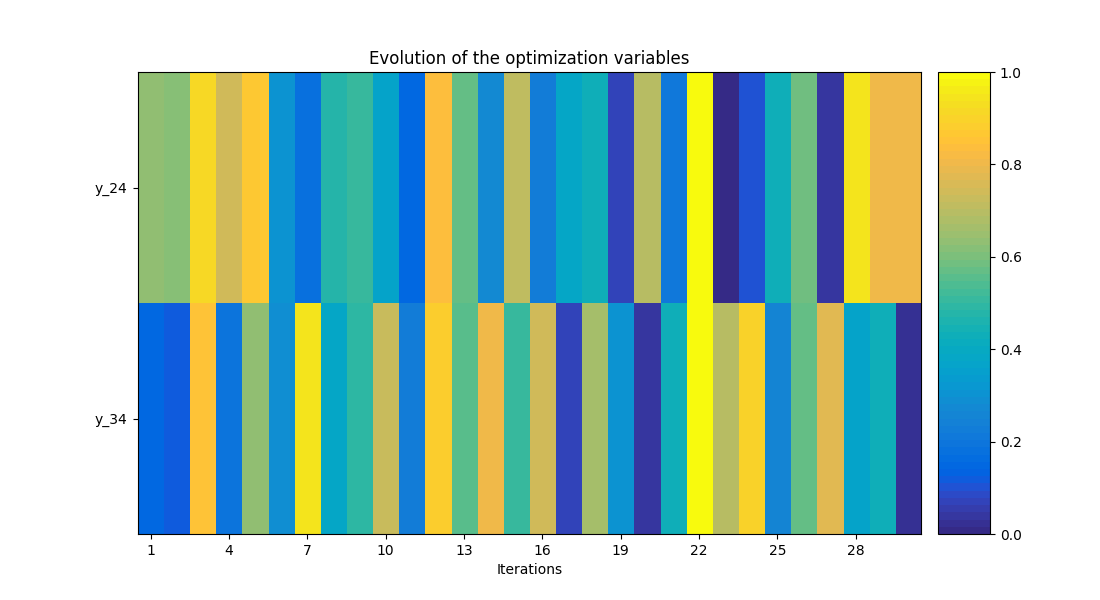
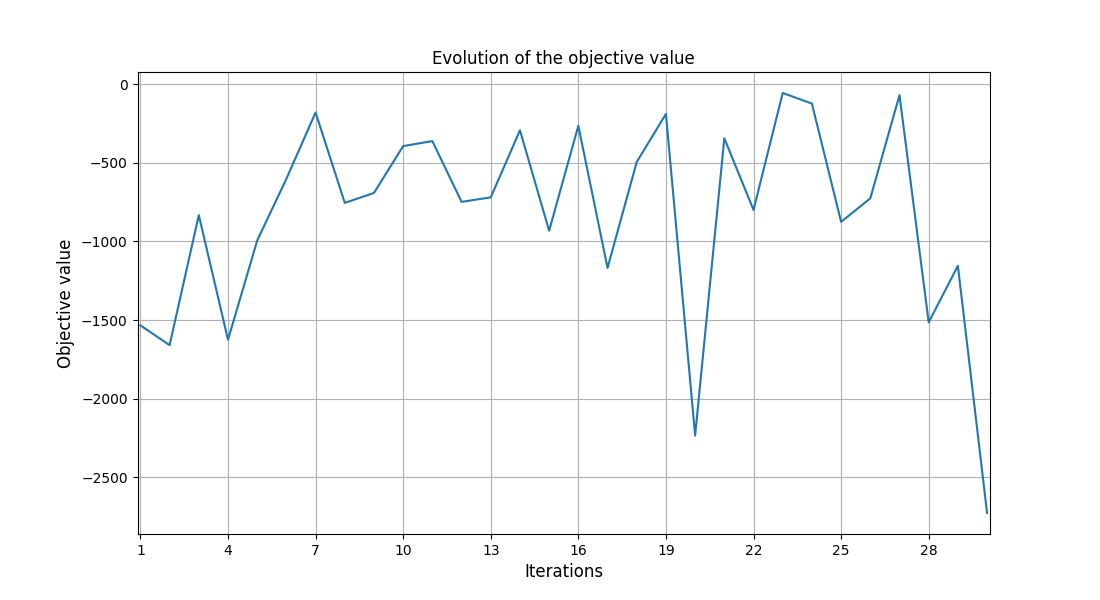
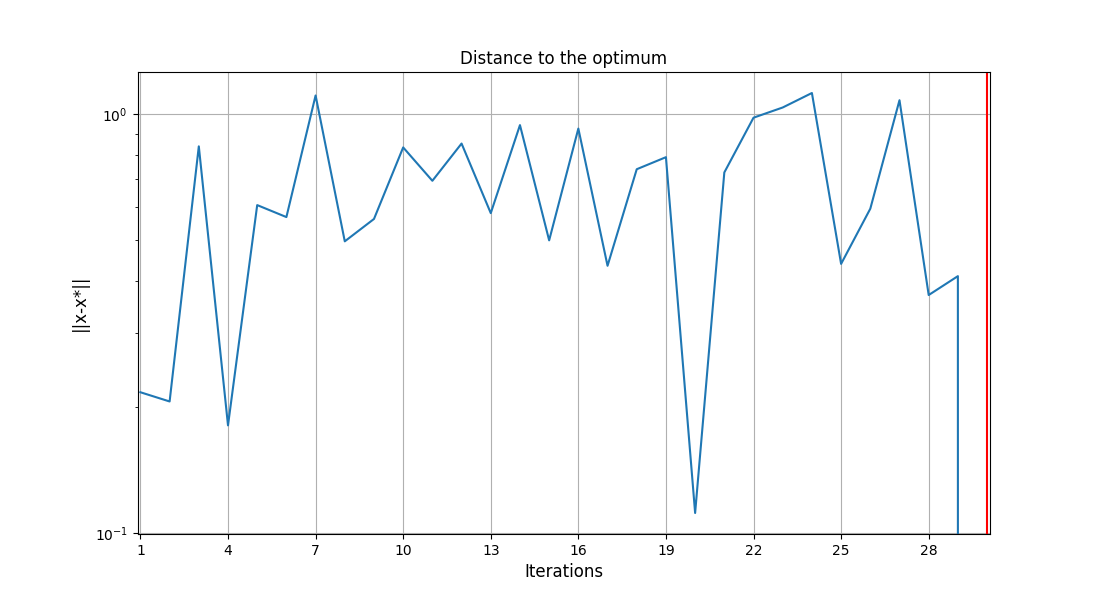
Plot optimization history view
scenario.post_process("OptHistoryView", save=False, show=True)
<gemseo.post.opt_history_view.OptHistoryView object at 0x7f1da7cd93a0>
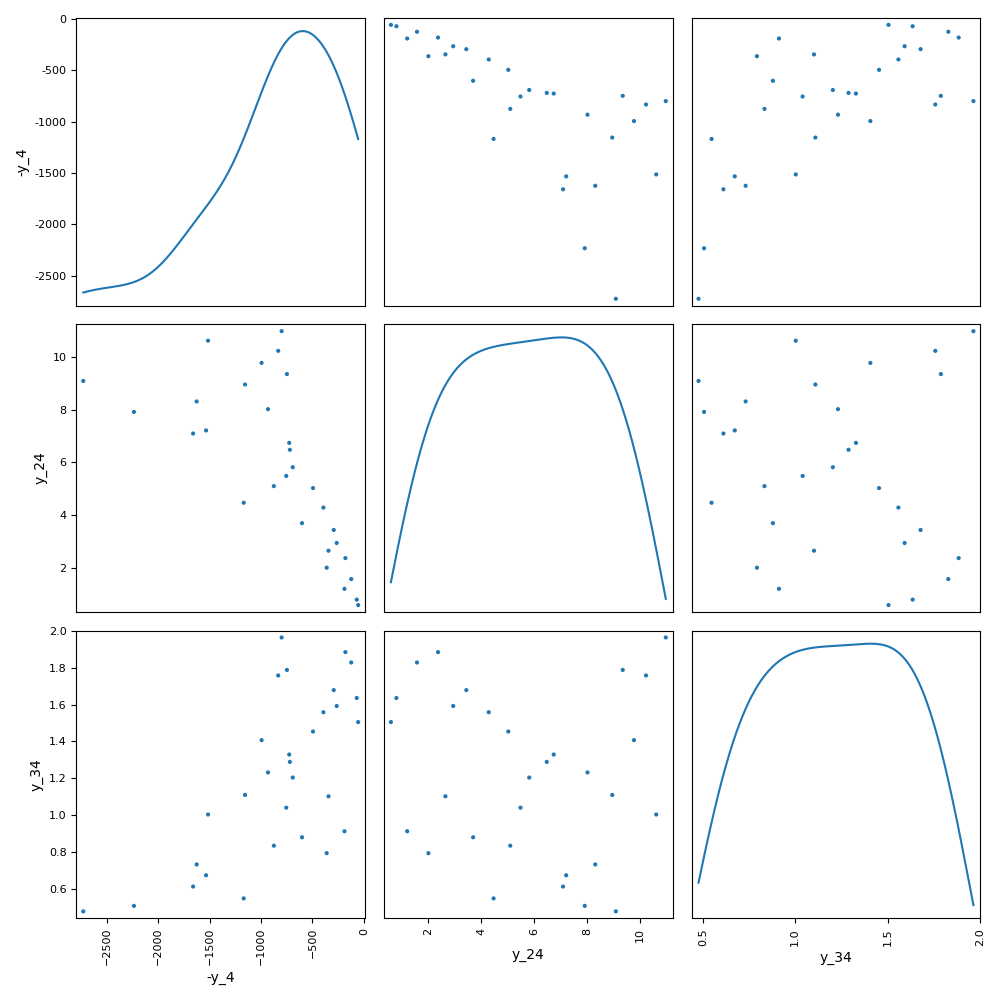
Plot parallel coordinates
scenario.post_process(
    "ScatterPlotMatrix",
    variable_names=["y_4", "y_24", "y_34"],
    save=False,
    show=True,
)
<gemseo.post.scatter_mat.ScatterPlotMatrix object at 0x7f1da7c85c40>
Total running time of the script: (0 minutes 1.295 seconds)