Note
Go to the end to download the full example code
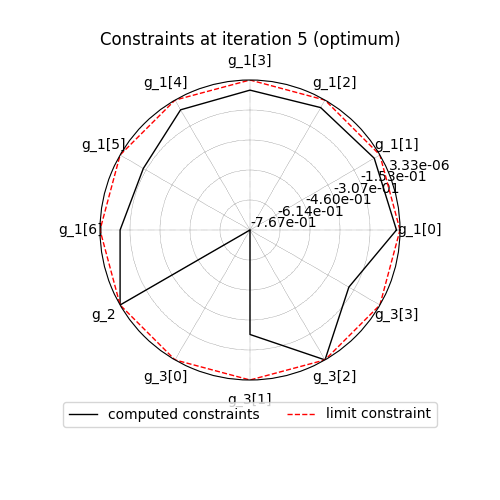
Radar chart
In this example, we illustrate the use of the
RadarChart plot
on the Sobieski’s SSBJ problem.
from __future__ import annotations

from gemseo import configure_logger
from gemseo import create_discipline
from gemseo import create_scenario
from gemseo.problems.mdo.sobieski.core.design_space import SobieskiDesignSpace
Import
The first step is to import some functions from the API and a method to get the design space.
configure_logger()
<RootLogger root (INFO)>
Description
The RadarChart post-processing
plots on a radar style chart a list of constraint functions
at a given iteration.
By default, the last iteration is used. This plot scales better with the number of constraints than the constraint plot provided by the opt_history_view.
Create disciplines
At this point, we instantiate the disciplines of Sobieski’s SSBJ problem: Propulsion, Aerodynamics, Structure and Mission
disciplines = create_discipline([
    "SobieskiPropulsion",
    "SobieskiAerodynamics",
    "SobieskiStructure",
    "SobieskiMission",
])
Create design space
We also create the SobieskiDesignSpace.
design_space = SobieskiDesignSpace()
Create and execute scenario
The next step is to build an MDO scenario in order to maximize the range, encoded ‘y_4’, with respect to the design parameters, while satisfying the inequality constraints ‘g_1’, ‘g_2’ and ‘g_3’. We can use the MDF formulation, the SLSQP optimization algorithm and a maximum number of iterations equal to 100.
scenario = create_scenario(
    disciplines,
    "MDF",
    "y_4",
    design_space,
    maximize_objective=True,
)
scenario.set_differentiation_method()
for constraint in ["g_1", "g_2", "g_3"]:
    scenario.add_constraint(constraint, constraint_type="ineq")
scenario.execute({"algo": "SLSQP", "max_iter": 10})
    INFO - 08:59:48:
    INFO - 08:59:48: *** Start MDOScenario execution ***
    INFO - 08:59:48: MDOScenario
    INFO - 08:59:48:    Disciplines: SobieskiAerodynamics SobieskiMission SobieskiPropulsion SobieskiStructure
    INFO - 08:59:48:    MDO formulation: MDF
    INFO - 08:59:48: Optimization problem:
    INFO - 08:59:48:    minimize -y_4(x_shared, x_1, x_2, x_3)
    INFO - 08:59:48:    with respect to x_1, x_2, x_3, x_shared
    INFO - 08:59:48:    subject to constraints:
    INFO - 08:59:48:       g_1(x_shared, x_1, x_2, x_3) <= 0.0
    INFO - 08:59:48:       g_2(x_shared, x_1, x_2, x_3) <= 0.0
    INFO - 08:59:48:       g_3(x_shared, x_1, x_2, x_3) <= 0.0
    INFO - 08:59:48:    over the design space:
    INFO - 08:59:48:       +-------------+-------------+-------+-------------+-------+
    INFO - 08:59:48:       | Name        | Lower bound | Value | Upper bound | Type  |
    INFO - 08:59:48:       +-------------+-------------+-------+-------------+-------+
    INFO - 08:59:48:       | x_shared[0] |     0.01    |  0.05 |     0.09    | float |
    INFO - 08:59:48:       | x_shared[1] |    30000    | 45000 |    60000    | float |
    INFO - 08:59:48:       | x_shared[2] |     1.4     |  1.6  |     1.8     | float |
    INFO - 08:59:48:       | x_shared[3] |     2.5     |  5.5  |     8.5     | float |
    INFO - 08:59:48:       | x_shared[4] |      40     |   55  |      70     | float |
    INFO - 08:59:48:       | x_shared[5] |     500     |  1000 |     1500    | float |
    INFO - 08:59:48:       | x_1[0]      |     0.1     |  0.25 |     0.4     | float |
    INFO - 08:59:48:       | x_1[1]      |     0.75    |   1   |     1.25    | float |
    INFO - 08:59:48:       | x_2         |     0.75    |   1   |     1.25    | float |
    INFO - 08:59:48:       | x_3         |     0.1     |  0.5  |      1      | float |
    INFO - 08:59:48:       +-------------+-------------+-------+-------------+-------+
    INFO - 08:59:48: Solving optimization problem with algorithm SLSQP:
    INFO - 08:59:48:     10%|█         | 1/10 [00:00<00:00, 11.35 it/sec, obj=-536]
    INFO - 08:59:48:     20%|██        | 2/10 [00:00<00:00,  8.03 it/sec, obj=-2.12e+3]
 WARNING - 08:59:49: MDAJacobi has reached its maximum number of iterations but the normed residual 1.7130677857005655e-05 is still above the tolerance 1e-06.
    INFO - 08:59:49:     30%|███       | 3/10 [00:00<00:01,  6.74 it/sec, obj=-3.75e+3]
    INFO - 08:59:49:     40%|████      | 4/10 [00:00<00:00,  6.42 it/sec, obj=-3.96e+3]
    INFO - 08:59:49:     50%|█████     | 5/10 [00:00<00:00,  6.24 it/sec, obj=-3.96e+3]
    INFO - 08:59:49: Optimization result:
    INFO - 08:59:49:    Optimizer info:
    INFO - 08:59:49:       Status: 8
    INFO - 08:59:49:       Message: Positive directional derivative for linesearch
    INFO - 08:59:49:       Number of calls to the objective function by the optimizer: 6
    INFO - 08:59:49:    Solution:
    INFO - 08:59:49:       The solution is feasible.
    INFO - 08:59:49:       Objective: -3963.408265187933
    INFO - 08:59:49:       Standardized constraints:
    INFO - 08:59:49:          g_1 = [-0.01806104 -0.03334642 -0.04424946 -0.0518346  -0.05732607 -0.13720865
    INFO - 08:59:49:  -0.10279135]
    INFO - 08:59:49:          g_2 = 3.333278582928756e-06
    INFO - 08:59:49:          g_3 = [-7.67181773e-01 -2.32818227e-01  8.30379541e-07 -1.83255000e-01]
    INFO - 08:59:49:       Design space:
    INFO - 08:59:49:          +-------------+-------------+---------------------+-------------+-------+
    INFO - 08:59:49:          | Name        | Lower bound |        Value        | Upper bound | Type  |
    INFO - 08:59:49:          +-------------+-------------+---------------------+-------------+-------+
    INFO - 08:59:49:          | x_shared[0] |     0.01    | 0.06000083331964572 |     0.09    | float |
    INFO - 08:59:49:          | x_shared[1] |    30000    |        60000        |    60000    | float |
    INFO - 08:59:49:          | x_shared[2] |     1.4     |         1.4         |     1.8     | float |
    INFO - 08:59:49:          | x_shared[3] |     2.5     |         2.5         |     8.5     | float |
    INFO - 08:59:49:          | x_shared[4] |      40     |          70         |      70     | float |
    INFO - 08:59:49:          | x_shared[5] |     500     |         1500        |     1500    | float |
    INFO - 08:59:49:          | x_1[0]      |     0.1     |         0.4         |     0.4     | float |
    INFO - 08:59:49:          | x_1[1]      |     0.75    |         0.75        |     1.25    | float |
    INFO - 08:59:49:          | x_2         |     0.75    |         0.75        |     1.25    | float |
    INFO - 08:59:49:          | x_3         |     0.1     |  0.1562448753887276 |      1      | float |
    INFO - 08:59:49:          +-------------+-------------+---------------------+-------------+-------+
    INFO - 08:59:49: *** End MDOScenario execution (time: 0:00:00.917693) ***

{'max_iter': 10, 'algo': 'SLSQP'}
Post-process scenario
Lastly, we post-process the scenario by means of the
RadarChart.
Tip
Each post-processing method requires different inputs and offers a variety
of customization options. Use the API function
get_post_processing_options_schema() to print a table with
the options for any post-processing algorithm.
Or refer to our dedicated page:
Post-processing algorithms.
scenario.post_process(
    "RadarChart",
    constraint_names=["g_1", "g_2", "g_3"],
    save=False,
    show=True,
    fig_size=(5, 5),
)
<gemseo.post.radar_chart.RadarChart object at 0x7f1da3c0d490>
Total running time of the script: (0 minutes 1.171 seconds)