andrews_curves module
Draw Andrews curves from a Dataset.
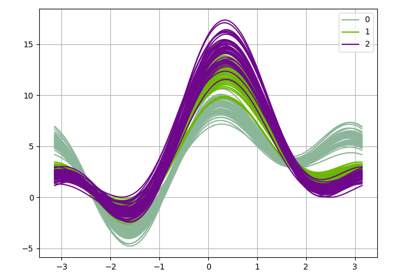
The AndrewsCurves class implements the Andrew plot, a.k.a. Andrews curves,
which is a way to visualize \(n\) samples of a high-dimensional vector
in a 2D referential by projecting each sample
onto the vector
which is composed of the \(d\) first elements of the Fourier series:
Each curve \(t\mapsto f_i(t)\) is plotted over the interval \([-\pi,\pi]\) and structure in the data may be visible in these \(n\) Andrews curves.
A variable name can be passed to the DatasetPlot.execute() method
by means of the classifier keyword
in order to color the curves according to the value of the variable name.
This is useful when the data is labeled.
- class gemseo.post.dataset.andrews_curves.AndrewsCurves(dataset, classifier)[source]
Bases:
DatasetPlotAndrews curves.
- Parameters:
- Raises:
ValueError – If the dataset is empty.
- class PlotEngine(value)
Bases:
StrEnumAn engine of plots.
- MATPLOTLIB = 'MatplotlibPlotFactory'
- PLOTLY = 'PlotlyPlotFactory'
- execute(save=True, show=False, file_path='', directory_path='', file_name='', file_format='png', file_name_suffix='', **engine_parameters)
Execute the post-processing.
- Parameters:
save (bool) –
Whether to save the plot.
By default it is set to True.
show (bool) –
Whether to display the plot.
By default it is set to False.
file_path (str | Path) –
The path of the file to save the figures. If empty, create a file path from
directory_path,file_nameandfile_format.By default it is set to “”.
directory_path (str | Path) –
The path of the directory to save the figures. If empty, use the current working directory.
By default it is set to “”.
file_name (str) –
The name of the file to save the figures. If empty, use a default one generated by the post-processing.
By default it is set to “”.
file_format (str) –
A file format, e.g. ‘png’, ‘pdf’, ‘svg’, …
By default it is set to “png”.
file_name_suffix (str) –
The suffix to be added to the file name.
By default it is set to “”.
**engine_parameters (Any) – The parameters specific to the plot engine.
- Returns:
The figures.
- Return type:
- DEFAULT_PLOT_ENGINE: ClassVar[PlotEngine] = 'MatplotlibPlotFactory'
The default engine of plots.
- FILE_FORMATS_TO_PLOT_ENGINES: ClassVar[dict[str, PlotEngine]] = {'html': PlotEngine.PLOTLY}
The file formats bound to the engines of plots.
The method
execute()uses this dictionary to select the engine of plots associated with itsfile_formatargument. If missing, the method uses theDEFAULT_PLOT_ENGINE.
- property color: str | list[str]
The color.
Either a global one or one per item if
n_itemsis non-zero. If empty, use a default one.
- property fig_size: FigSizeType
The figure size.
- property linestyle: str | Sequence[str]
The line style.
Either a global one or one per item if
n_itemsis non-zero. If empty, use a default one.