boxplot module
Draw the boxplots of some variables from a Dataset.
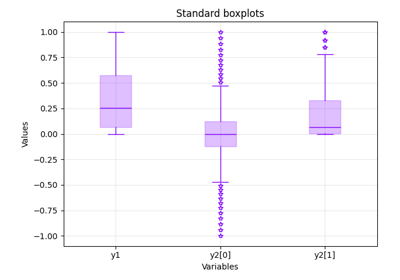
A boxplot represents the median and the first and third quartiles of numerical data. The variability outside the inter quartile domain can be represented with lines, called whiskers. The numerical data that are significantly different are called outliers and can be plotted as individual points beyond the whiskers.
- class gemseo.post.dataset.boxplot.Boxplot(dataset, *datasets, variables=(), center=False, scale=False, use_vertical_bars=True, add_confidence_interval=False, add_outliers=True, opacity_level=0.25, **boxplot_options)[source]
Bases:
DatasetPlotDraw the boxplots of some variables from a
Dataset.- Parameters:
dataset (Dataset) – The dataset containing the data to plot.
*datasets (Dataset) – Datasets containing other series of data to plot.
variables (Iterable[str]) –
The names of the variables to plot. If empty, use all the variables.
By default it is set to ().
center (bool) –
Whether to center the variables so that they have a zero mean.
By default it is set to False.
scale (bool) –
Whether to scale the variables so that they have a unit variance.
By default it is set to False.
use_vertical_bars (bool) –
Whether to use vertical bars.
By default it is set to True.
add_confidence_interval (bool) –
Whether to add the confidence interval (CI) around the median; a CI is also called notch.
By default it is set to False.
add_outliers (bool) –
Whether to add the outliers.
By default it is set to True.
opacity_level (float) –
The opacity level for the faces, between 0 and 1.
By default it is set to 0.25.
**boxplot_options (Any) – The options of the wrapped boxplot function.
- Raises:
ValueError – If the dataset is empty.
- opacity_level: float
The opacity level for the faces, between 0 and 1.