Note
Click here to download the full example code
Plot - Parallel coordinates
from __future__ import absolute_import, division, print_function, unicode_literals

from future import standard_library

from gemseo.api import configure_logger, load_dataset

configure_logger()

standard_library.install_aliases()
Load a dataset
iris = load_dataset("IrisDataset")
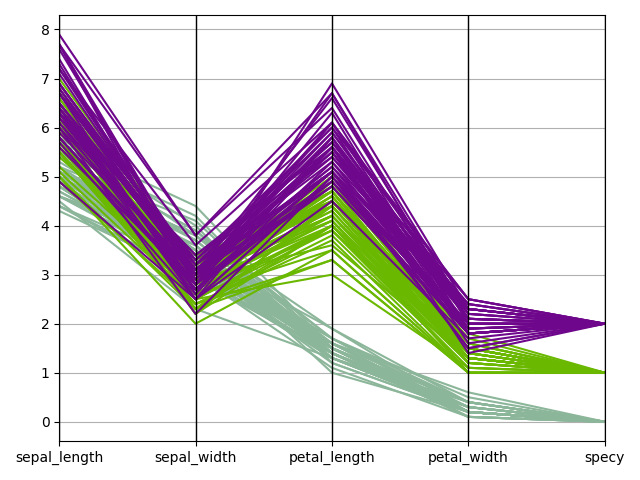
Plot parallel coordinates
We can use the
ParallelCoordinates plot,
a.k.a. cowebplot, where each samples is represented by a continuous straight
line in pieces whose nodes are indexed by the variables names and measure the
variables values.
iris.plot("ParallelCoordinates", classifier="specy")
Out:
<gemseo.post.dataset.parallel_coordinates.ParallelCoordinates object at 0x7fc29da0c9a0>
Total running time of the script: ( 0 minutes 0.377 seconds)