Note
Click here to download the full example code
Plot - Andrews curves
from __future__ import absolute_import, division, print_function, unicode_literals

from future import standard_library

from gemseo.api import configure_logger, load_dataset

configure_logger()

standard_library.install_aliases()
Load a dataset
iris = load_dataset("IrisDataset")
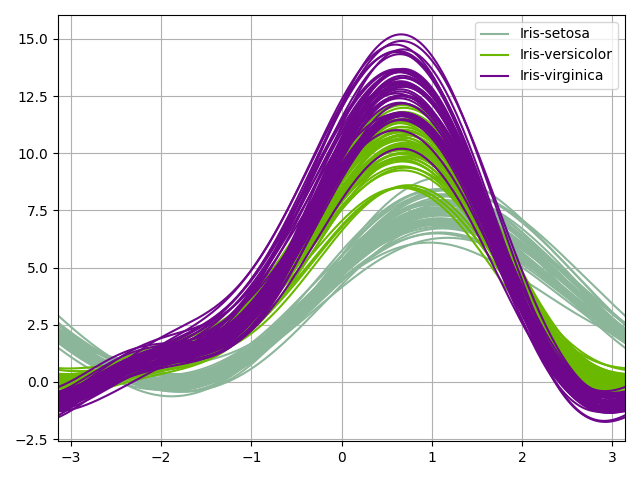
Plot Andrews Curves
We can use the AndrewsCurves plot
which can be viewed as a smooth
version of the parallel coordinates. Each sample is represented by a curve
and if there is structure in data, it may be visible in the plot.
iris.plot("AndrewsCurves", classifier="specy")
Out:
<gemseo.post.dataset.andrews_curves.AndrewsCurves object at 0x7fc29da0c1c0>
Total running time of the script: ( 0 minutes 0.368 seconds)