Radar chart
Preliminaries: instantiation and execution of the MDO scenario
Let’s start with the following code lines which instantiate and execute the MDOScenario :
from gemseo.api import create_discipline, create_scenario

formulation = 'MDF'

disciplines = create_discipline(["SobieskiPropulsion", "SobieskiAerodynamics",
                                 "SobieskiMission", "SobieskiStructure"])

scenario = create_scenario(disciplines,
                           formulation=formulation,
                           objective_name="y_4",
                           maximize_objective=True,
                           design_space="design_space.txt")

scenario.set_differentiation_method("user")

algo_options = {'max_iter': 10, 'algo': "SLSQP"}
for constraint in ["g_1","g_2","g_3"]:
    scenario.add_constraint(constraint, 'ineq')

scenario.execute(algo_options)
RadarChart
Description
The RadarChart post processing
plots on radar style chart a list of constraint functions
at a given iteration.
By default, the iteration is the last one. It is possible either to save the plot, to show the plot or both.
This plot scales better with the number of constraints than the constraint plot provided by the History of evaluations
Options
constraints_list,
list(str)- list of constraints namesextension,
str- file extensionfile_path,
str- the base paths of the files to exportiteration,
int- number of iteration to post processsave,
bool- if True, exports plot to pdfshow,
bool- if True, displays the plot windows
Similarly, a radar constraint plot that scales better with the number of constraints, but at a single iteration,
can be plotted by using the API method execute_post() with the keyword “RadarChart” and
additional arguments concerning the type of display (file, screen, both).
Case of the MDF formulation
To visualize the radar constraint chart of the scenario,
we use the execute_post() API method with the keyword "ConstraintsHistory"
and additional arguments concerning the type of display (file, screen, both):
scenario.post_process(“RadarChart”, constraints_list=["g_1", "g_2", "g_3"], save=True, show=False, file_path=“mdf”)
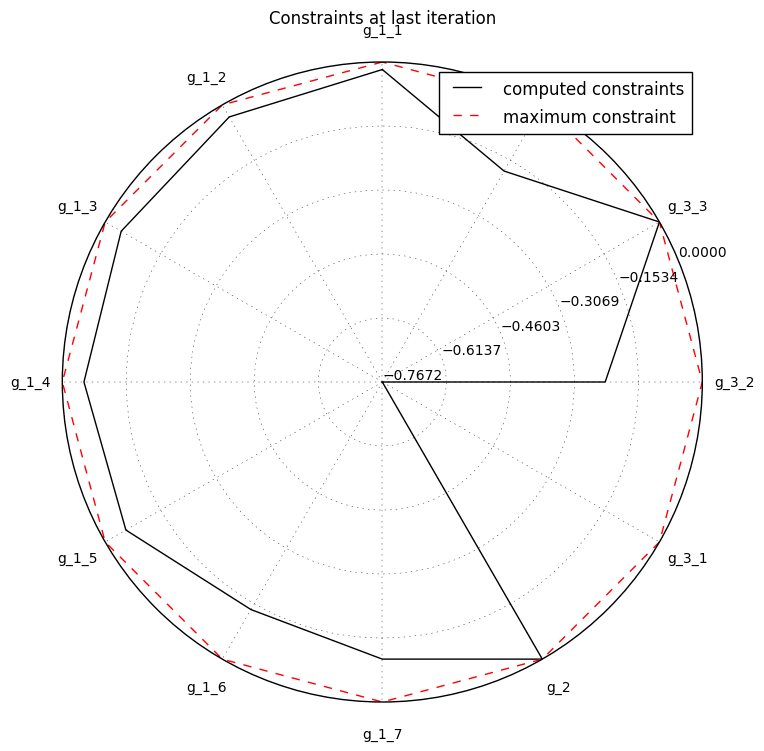
History of the constraints on the Sobieski use case for the MDF formulation using the RadarChart plot