Variable influence
Preliminaries: instantiation and execution of the MDO scenario
Let’s start with the following code lines which instantiate and execute the MDOScenario :
from gemseo.api import create_discipline, create_scenario

formulation = 'MDF'

disciplines = create_discipline(["SobieskiPropulsion", "SobieskiAerodynamics",
                                 "SobieskiMission", "SobieskiStructure"])

scenario = create_scenario(disciplines,
                           formulation=formulation,
                           objective_name="y_4",
                           maximize_objective=True,
                           design_space="design_space.txt")

scenario.set_differentiation_method("user")

algo_options = {'max_iter': 10, 'algo': "SLSQP"}
for constraint in ["g_1","g_2","g_3"]:
    scenario.add_constraint(constraint, 'ineq')

scenario.execute(algo_options)
VariableInfluence
Description
The VariableInfluence post processing performs first order variable influence analysis.
The method computes \(\frac{d f}{d x_i} \cdot \left(x_{i_*} - x_{i_0}\right)\), where \(x_{i_0}\) is the initial value of the variable and \(x_{i_*}\) is the optimal value of the variable.
Options of the plot method are the x- and y- figure sizes, the quantile level, the use of a logarithmic scale and the possibility to save the influent variables indices as a numpy file. It is also possible either to save the plot, to show the plot or both.
Options
quantile,
float- Between 0 and 1, the proportion of the total sensitivity to use as a threshold to filter the variables.absolute_value,
bool- If True, plot the absolute value of the influence.log_scale,
bool- If True, use a logarithmic scale.save_var_files,
bool- If True, save the influent variables indices as a NumPy file.extension,
str- The file extension.figsize_x,
int- The size of the figure in the horizontal direction (inches).figsize_y,
int- The size of the figure in the vertical direction (inches).file_path,
str- The base path of the files to export. Relative to the working directory.save,
bool- If True, export the plot to a file.show,
bool- If True, display the plot windows.
Case of the MDF formulation
To visualize the variable influence plot of the scenario,
we use the execute_post() API method with the keyword "VariableInfluence"
and additional arguments concerning the type of display (file, screen, both):
scenario.post_process("VariableInfluence", save=True, show=False,file_path="mdf" )
The figure Variable influence on the Sobieski use case for the MDF formulation shows the total derivatives of the objective and constraints with respect to the design variables: \(\frac{d f}{d x_i}\):
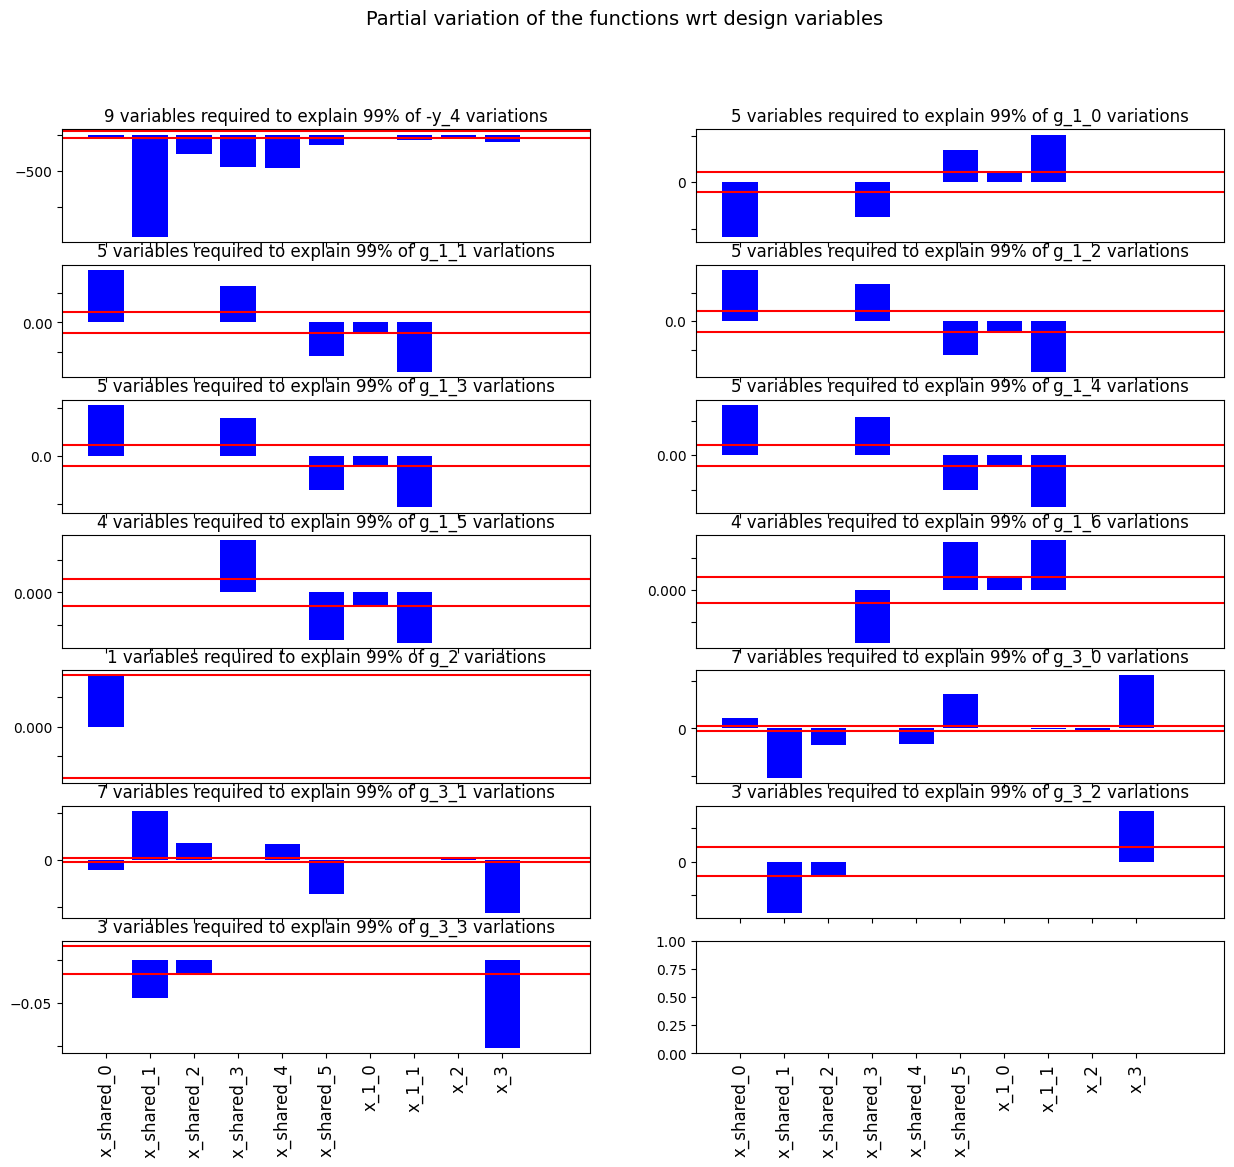
Variable influence on the Sobieski use case for the MDF formulation