Sensitivity analysis
The package sensitivity
Capabilities to run a sensitivity analysis.
This package contains:
an abstract class
SensitivityAnalysisto define the concept of sensitivity analysis,a factory
SensitivityAnalysisFactoryto create instances ofSensitivityAnalysis,concrete classes implementing this abstract class:
CorrelationAnalysis(based on OpenTURNS capabilities)SobolAnalysis(based on OpenTURNS capabilities),
The base class SensitivityAnalysis
Abstract class for the computation and analysis of sensitivity indices.
The purpose of a sensitivity analysis is to qualify or quantify how the model’s uncertain inputs impact its output.
This analysis relies on SensitivityAnalysis
computed from a MDODiscipline representing the model,
a ParameterSpace describing the uncertain parameters
and options associated with a particular concrete class
inheriting from SensitivityAnalysis which is an abstract one.
Classes:
|
Sensitivity analysis. |
- class gemseo.uncertainty.sensitivity.analysis.SensitivityAnalysis(discipline, parameter_space, n_samples, algo=None, algo_options=None)[source]
Sensitivity analysis.
The
SensitivityAnalysisclass provides both the values ofSensitivityAnalysis.indicesand their graphical representations, from either theSensitivityAnalysis.plot()method, theSensitivityAnalysis.plot_radar()method or theSensitivityAnalysis.plot_bar()method.It is also possible to use
SensitivityAnalysis.sort_parameters()to get the parameters sorted according toSensitivityAnalysis.main_method. TheSensitivityAnalysis.main_indicesare indices computed with the latter.Lastly, the
SensitivityAnalysis.plot_comparison()method allows to compare the currentSensitivityAnalysiswith another one.- Attributes
default_output (list(str)) – The default outputs of interest.
dataset (Dataset) – The dataset containing the discipline evaluations.
- Parameters
discipline (MDODiscipline) –
parameter_space (ParameterSpace) –
n_samples (int) –
algo (Optional[str]) –
algo_options (Optional[Mapping]) –
- Return type
None
Initialize self. See help(type(self)) for accurate signature.
- Parameters
discipline (MDODiscipline) – A discipline.
parameter_space (ParameterSpace) – A parameter space.
n_samples (int) – A number of samples.
algo (Optional[str]) – The name of the DOE algorithm. If None, use the
DEFAULT_DRIVER.algo_options (Optional[Mapping]) – The options of the DOE algorithm.
- Return type
None
Methods:
compute_indices([outputs])Compute the sensitivity indices.
Convert this
SensitivityIndicesinstance into aDataset.plot(output[, inputs, title, save, show, …])Plot the sensitivity indices.
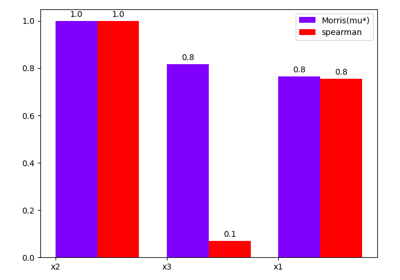
plot_bar(outputs[, inputs, title, save, …])Plot the sensitivity indices on a bar chart.
plot_comparison(indices, output[, inputs, …])Plot a comparison between the current sensitivity indices and other ones.
plot_field(output[, mesh, inputs, title, …])Plot the sensitivity indices related to a 1D or 2D functional output.
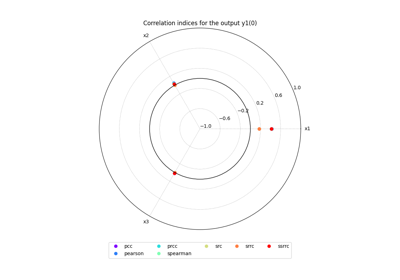
plot_radar(outputs[, inputs, title, save, …])Plot the sensitivity indices on a radar chart.
sort_parameters(output)Return the parameters sorted in descending order.
Attributes:
The sensitivity indices.
The name of the inputs.
The main sensitivity indices.
The name of the main method.
- compute_indices(outputs=None)[source]
Compute the sensitivity indices.
- Parameters
outputs (Optional[Sequence[str]]) – The outputs for which to display sensitivity indices. If None, use the default outputs, that are all the discipline outputs.
- Returns
The sensitivity indices.
With the following structure:
{
    "method_name": {
        "output_name": [
            {
                "input_name": data_array,
            }
        ]
    }
}
- Return type
Dict[str, Dict[str, Dict[str, numpy.ndarray]]]
- export_to_dataset()[source]
Convert this
SensitivityIndicesinstance into aDataset.- Returns
The sensitivity indices.
- Return type
- property indices
The sensitivity indices.
With the following structure:
{
    "method_name": {
        "output_name": [
            {
                "input_name": data_array,
            }
        ]
    }
}
- property inputs_names
The name of the inputs.
- property main_indices
The main sensitivity indices.
With the following structure:
{
    "output_name": [
        {
            "input_name": data_array,
        }
    ]
}
- property main_method
The name of the main method.
- plot(output, inputs=None, title=None, save=True, show=False, file_path=None, file_format=None)[source]
Plot the sensitivity indices.
- Parameters
output (Union[str, Tuple[str, int]]) – The output for which to display sensitivity indices, either a name or a tuple of the form (name, component). If name, its first component is considered.
inputs (Optional[Iterable[str]]) – The inputs to display. If None, display all.
title (Optional[str]) – The title of the plot. If None, no title.
save (bool) – If True, save the figure.
show (bool) – If True, show the figure.
file_path (Optional[Union[str, pathlib.Path]]) – A file path. Either a complete file path, a directory name or a file name. If None, use a default file name and a default directory. The file extension is inferred from filepath extension, if any.
file_format (Optional[str]) – A file format, e.g. ‘png’, ‘pdf’, ‘svg’, … Used when
file_pathdoes not have any extension. If None, use a default file extension.
- Return type
None
- plot_bar(outputs, inputs=None, title=None, save=True, show=False, file_path=None, directory_path=None, file_name=None, file_format=None, **options)[source]
Plot the sensitivity indices on a bar chart.
This method may consider one or more outputs, as well as all inputs (default behavior) or a subset.
- Parameters
outputs (Union[str, Tuple[str, int], Sequence[Union[str, Tuple[str, int]]]]) – The outputs for which to display sensitivity indices, either a name, a list of names, a (name, component) tuple, a list of such tuples or a list mixing such tuples and names. When a name is specified, all its components are considered. If None, use the default outputs.
inputs (Optional[Iterable[str]]) – The inputs to display. If None, display all.
title (Optional[str]) – The title of the plot. If None, no title.
save (bool) – If True, save the figure.
show (bool) – If True, show the figure.
file_path (Optional[Union[str, pathlib.Path]]) – The path of the file to save the figures. If the extension is missing, use
file_extension. If None, create a file path fromdirectory_path,file_nameandfile_extension.directory_path (Optional[Union[str, pathlib.Path]]) – The path of the directory to save the figures. If None, use the current working directory.
file_name (Optional[str]) – The name of the file to save the figures. If None, use a default one generated by the post-processing.
file_format (Optional[str]) – A file extension, e.g. ‘png’, ‘pdf’, ‘svg’, … If None, use a default file extension.
options (int) –
- Returns
A bar chart representing the sensitivity indices.
- Return type
- plot_comparison(indices, output, inputs=None, title=None, use_bar_plot=True, save=True, show=False, file_path=None, directory_path=None, file_name=None, file_format=None, **options)[source]
Plot a comparison between the current sensitivity indices and other ones.
This method allows to use either a bar chart (default option) or a radar one.
- Parameters
indices (List[gemseo.uncertainty.sensitivity.analysis.SensitivityAnalysis]) – The sensitivity indices.
output (Union[str, Tuple[str, int]]) – The output for which to display sensitivity indices, either a name or a tuple of the form (name, component). If name, its first component is considered.
inputs (Optional[Iterable[str]]) – The inputs to display. If None, display all.
title (Optional[str]) – The title of the plot. If None, no title.
use_bar_plot (bool) – The type of graph. If True, use a bar plot. Otherwise, use a radar chart.
save (bool) – If True, save the figure.
show (bool) – If True, show the figure.
file_path (Optional[Union[str, pathlib.Path]]) – The path of the file to save the figures. If None, create a file path from
directory_path,file_nameandfile_format.directory_path (Optional[Union[str, pathlib.Path]]) – The path of the directory to save the figures. If None, use the current working directory.
file_name (Optional[str]) – The name of the file to save the figures. If None, use a default one generated by the post-processing.
file_format (Optional[str]) – A file format, e.g. ‘png’, ‘pdf’, ‘svg’, … If None, use a default file extension.
**options – The options passed to the underlying
DatasetPlot.options (bool) –
- Returns
A graph comparing sensitivity indices.
- Return type
Union[gemseo.post.dataset.bars.BarPlot, gemseo.post.dataset.radar_chart.RadarChart]
- plot_field(output, mesh=None, inputs=None, title=None, save=True, show=False, file_path=None, directory_path=None, file_name=None, file_format=None, properties=None)[source]
Plot the sensitivity indices related to a 1D or 2D functional output.
The output is considered as a 1D or 2D functional variable, according to the shape of the mesh on which it is represented.
- Parameters
output (Union[str, Tuple[str, int]]) – The output for which to display sensitivity indices, either a name or a tuple of the form (name, component). If name, its first component is considered.
mesh (Optional[numpy.ndarray]) – The mesh on which the p-length output is represented. Either a (1, p) array for a 1D functional output or a (2, p) array for a 2D one. If None, assume a 1D functional output.
inputs (Optional[Iterable[str]]) – The inputs to display. If None, display all inputs.
title (Optional[str]) – The title of the plot. If None, no title is displayed.
save (bool) – If True, save the figure.
show (bool) – If True, show the figure.
file_path (Optional[Union[str, pathlib.Path]]) – The path of the file to save the figures. If None, create a file path from
directory_path,file_nameandfile_extension.directory_path (Optional[Union[str, pathlib.Path]]) – The path of the directory to save the figures. If None, use the current working directory.
file_name (Optional[str]) – The name of the file to save the figures. If None, use a default one generated by the post-processing.
file_format (Optional[str]) – A file extension, e.g. ‘png’, ‘pdf’, ‘svg’, … If None, use a default file extension.
properties (Optional[Mapping]) – The general properties of a
DatasetPlot.
- Return type
Union[gemseo.post.dataset.curves.Curves, gemseo.post.dataset.surfaces.Surfaces]
- plot_radar(outputs, inputs=None, title=None, save=True, show=False, file_path=None, directory_path=None, file_name=None, file_format=None, min_radius=None, max_radius=None, **options)[source]
Plot the sensitivity indices on a radar chart.
This method may consider one or more outputs, as well as all inputs (default behavior) or a subset.
For visualization purposes, it is also possible to change the minimum and maximum radius values.
- Parameters
outputs (Union[str, Tuple[str, int], Sequence[Union[str, Tuple[str, int]]]]) – The outputs for which to display sensitivity indices, either a name, a list of names, a (name, component) tuple, a list of such tuples or a list mixing such tuples and names. When a name is specified, all its components are considered. If None, use the default outputs.
inputs (Optional[Iterable[str]]) – The inputs to display. If None, display all.
title (Optional[str]) – The title of the plot. If None, no title.
save (bool) – If True, save the figure.
show (bool) – If True, show the figure.
file_path (Optional[Union[str, pathlib.Path]]) – The path of the file to save the figures. If the extension is missing, use
file_extension. If None, create a file path fromdirectory_path,file_nameandfile_extension.directory_path (Optional[Union[str, pathlib.Path]]) – The path of the directory to save the figures. If None, use the current working directory.
file_name (Optional[str]) – The name of the file to save the figures. If None, use a default one generated by the post-processing.
file_format (Optional[str]) – A file extension, e.g. ‘png’, ‘pdf’, ‘svg’, … If None, use a default file extension.
min_radius (Optional[float]) – The minimal radial value. If None, from data.
max_radius (Optional[float]) – The maximal radial value. If None, from data.
options (bool) –
- Returns
A radar chart representing the sensitivity indices.
- Return type
- sort_parameters(output)[source]
Return the parameters sorted in descending order.
- Parameters
output (Tuple[str, int]) – An output of the form (name, component), where name is the output name and component is the output component.
- Returns
The input parameters sorted in descending order.
- Return type
List[str]