Note
Click here to download the full example code
Plot - Scatter
from __future__ import division, unicode_literals

from matplotlib import pyplot as plt
from numpy import linspace, pi, sin

from gemseo.api import configure_logger
from gemseo.core.dataset import Dataset

configure_logger()
Out:
<RootLogger root (INFO)>
Build a dataset
inputs = linspace(0, 1, 20)[:, None]
outputs = sin(2 * pi * inputs)
color = ["b" if abs(output) > 0.5 else "r" for output in outputs]

dataset = Dataset()
dataset.add_variable("x", inputs, "inputs")
dataset.add_variable("y", outputs, "outputs", cache_as_input=False)
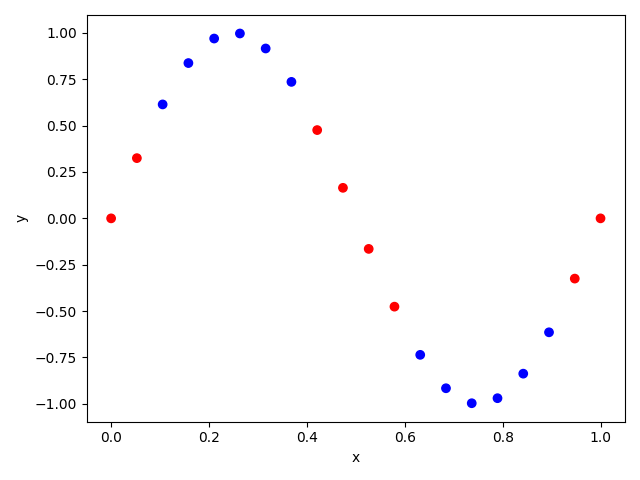
Plot y vs x
We can use the Scatter plot
dataset.plot("Scatter", x="x", y="y", properties={"color": color}, show=False)
# Workaround for HTML rendering, instead of ``show=True``
plt.show()
Total running time of the script: ( 0 minutes 0.173 seconds)