Note
Click here to download the full example code
Plot - Scatter matrix
from __future__ import division, unicode_literals

from matplotlib import pyplot as plt

from gemseo.api import configure_logger, load_dataset

configure_logger()
Out:
<RootLogger root (INFO)>
Load a dataset
iris = load_dataset("IrisDataset")
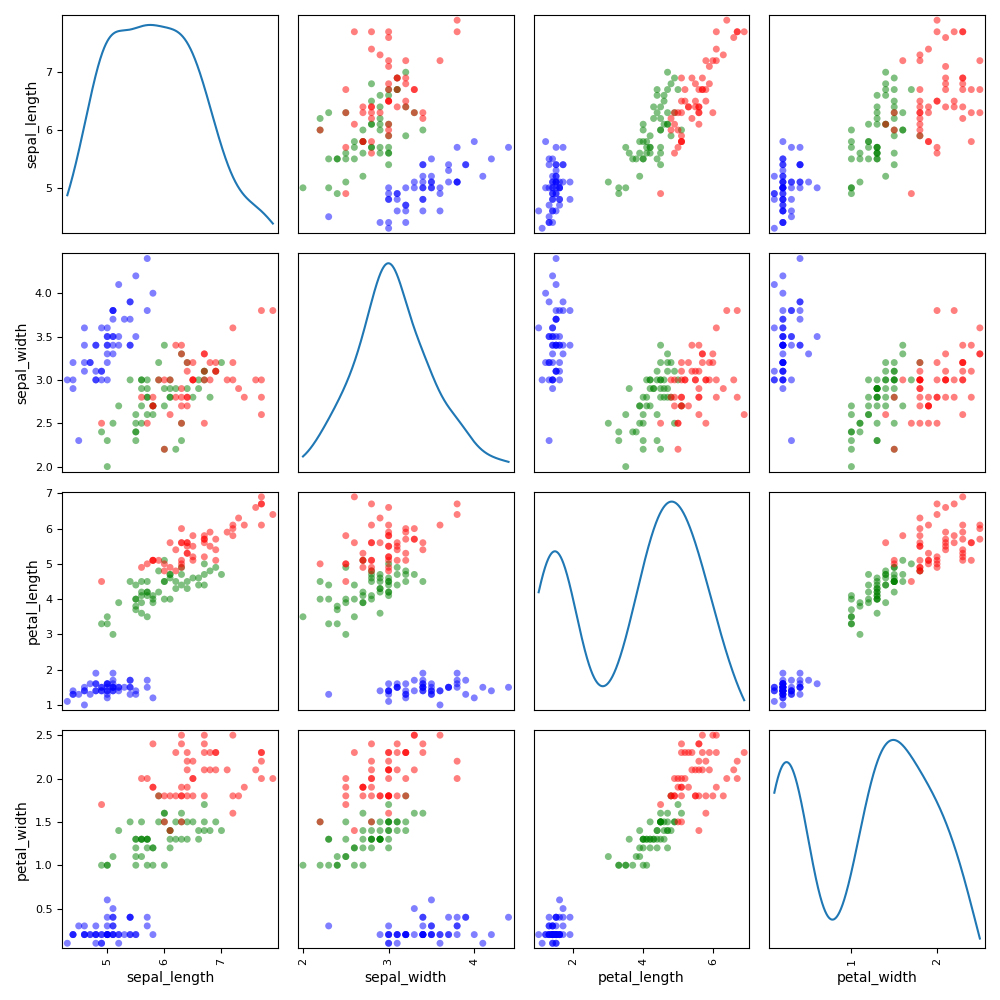
Plot scatter matrix
We can use the ScatterMatrix plot where each non-diagonal block
represents the samples according to the x- and y- coordinates names
while the diagonal ones approximate the probability distributions of the
variables, using either an histogram or a kernel-density estimator.
iris.plot("ScatterMatrix", classifier="specy", kde=True, show=False)
# Workaround for HTML rendering, instead of ``show=True``
plt.show()
Out:
/home/docs/checkouts/readthedocs.org/user_builds/gemseo/conda/3.2.0/lib/python3.8/site-packages/gemseo/post/dataset/scatter_plot_matrix.py:135: FutureWarning: In a future version of pandas all arguments of DataFrame.drop except for the argument 'labels' will be keyword-only
  dataframe = dataframe.drop(varname, 1)
Total running time of the script: ( 0 minutes 0.829 seconds)