Note
Click here to download the full example code
Plot - Parallel coordinates
from __future__ import division, unicode_literals

from matplotlib import pyplot as plt

from gemseo.api import configure_logger, load_dataset

configure_logger()
Out:
<RootLogger root (INFO)>
Load a dataset
iris = load_dataset("IrisDataset")
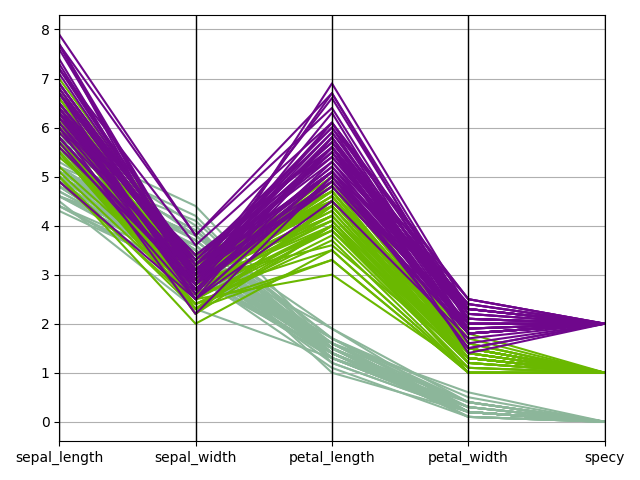
Plot parallel coordinates
We can use the
ParallelCoordinates plot,
a.k.a. cowebplot, where each samples is represented by a continuous straight
line in pieces whose nodes are indexed by the variables names and measure the
variables values.
iris.plot("ParallelCoordinates", classifier="specy", show=False)
# Workaround for HTML rendering, instead of ``show=True``
plt.show()
Total running time of the script: ( 0 minutes 0.357 seconds)