Note
Click here to download the full example code
Plot - ZvsXY
from __future__ import division, unicode_literals

from matplotlib import pyplot as plt

from gemseo.api import configure_logger, load_dataset

configure_logger()
Out:
<RootLogger root (INFO)>
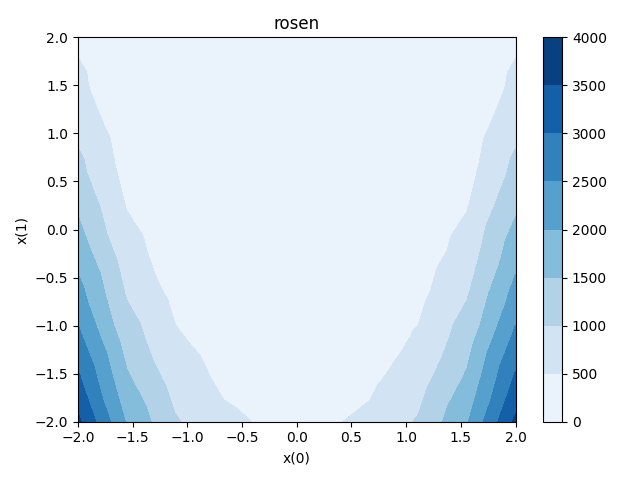
Load the Rosenbrock dataset
dataset = load_dataset("RosenbrockDataset")
Plot z vs x and y
We can use the ZvsXY plot
dataset.plot("ZvsXY", x="x", x_comp=0, y="x", y_comp=1, z="rosen", show=False)
# Workaround for HTML rendering, instead of ``show=True``
plt.show()
Total running time of the script: ( 0 minutes 0.211 seconds)