Note
Click here to download the full example code
Plot - Radar chart
from gemseo.api import configure_logger
from gemseo.core.dataset import Dataset
from gemseo.post.dataset.radar_chart import RadarChart
from matplotlib import pyplot as plt
from numpy import array

configure_logger()
Out:
<RootLogger root (INFO)>
Build a dataset
dataset = Dataset()
dataset.add_variable("x1", array([[0.2, 0.4, 0.5], [0.1, 0.3, 0.5]]))
dataset.add_variable("x2", array([[0.6], [0.5]]))
dataset.add_variable("x3", array([[0.8], [0.7]]))
dataset.row_names = ["series_1", "series_2"]
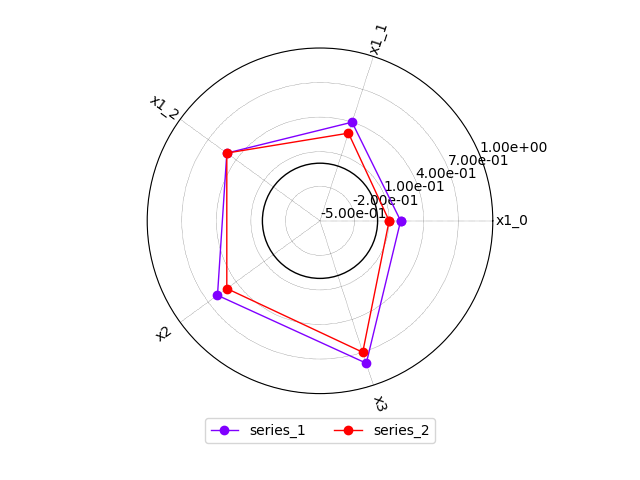
Plot the two series on a radar chart
We can use the RadarChart plot:
plot = RadarChart(dataset, connect=True, radial_ticks=True)
plot.rmin = -0.5
plot.rmax = 1.0
plot.execute(save=False, show=False)
# Workaround for HTML rendering, instead of ``show=True``
plt.show()
Total running time of the script: ( 0 minutes 0.115 seconds)