boxplot module
Draw the boxplots of some variables from a Dataset.
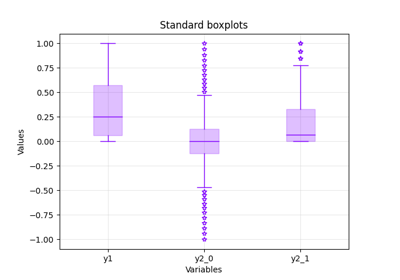
A boxplot represents the median and the first and third quartiles of numerical data. The variability outside the inter-quartile domain can be represented with lines, called whiskers. The numerical data that are significantly different are called outliers and can be plotted as individual points beyond the whiskers.
- class gemseo.post.dataset.boxplot.Boxplot(dataset, *datasets, variables=None, center=False, scale=False, use_vertical_bars=True, add_confidence_interval=False, add_outliers=True, **boxplot_options)[source]
Bases:
DatasetPlotDraw the boxplots of some variables from a
Dataset.- Parameters:
dataset (Dataset) – The dataset containing the data to plot.
*datasets (Dataset) – Datasets containing other series of data to plot.
variables (Sequence[str] | None) – The names of the variables to plot. If
None, use all the variables.center (bool) –
Whether to center the variables so that they have a zero mean.
By default it is set to False.
scale (bool) –
Whether to scale the variables so that they have a unit variance.
By default it is set to False.
use_vertical_bars (bool) –
Whether to use vertical bars.
By default it is set to True.
add_confidence_interval (bool) –
Whether to add the confidence interval (CI) around the median; a CI is also called notch.
By default it is set to False.
add_outliers (bool) –
Whether to add the outliers.
By default it is set to True.
**boxplot_options (Any) – The options of the wrapped boxplot function.
- Raises:
ValueError – If the dataset is empty.
- execute(save=True, show=False, file_path=None, directory_path=None, file_name=None, file_format=None, properties=None, fig=None, axes=None, **plot_options)
Execute the post processing.
- Parameters:
save (bool) –
If True, save the plot.
By default it is set to True.
show (bool) –
If True, display the plot.
By default it is set to False.
file_path (str | Path | None) – The path of the file to save the figures. If None, create a file path from
directory_path,file_nameandfile_format.directory_path (str | Path | None) – The path of the directory to save the figures. If None, use the current working directory.
file_name (str | None) – The name of the file to save the figures. If None, use a default one generated by the post-processing.
file_format (str | None) – A file format, e.g. ‘png’, ‘pdf’, ‘svg’, … If None, use a default file extension.
properties (Mapping[str, DatasetPlotPropertyType] | None) – The general properties of a
DatasetPlot.fig (None | Figure) – The figure to plot the data. If
None, create a new one.axes (None | Axes) – The axes to plot the data. If
None, create new ones.**plot_options – The options of the current class inheriting from
DatasetPlot.
- Returns:
The figures.
- Raises:
AttributeError – When the name of a property is not the name of an attribute.
- Return type:
list[Figure]