zvsxy module
Draw a variable versus two others from a Dataset.
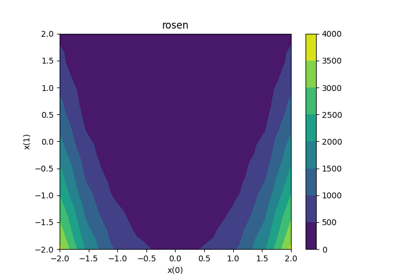
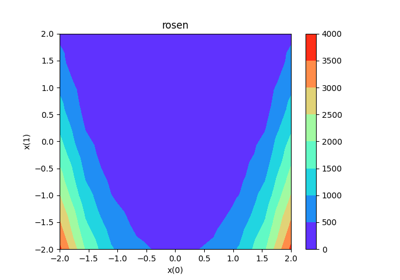
A ZvsXY plot represents the variable \(z\) with respect to
\(x\) and \(y\) as a surface plot, based on a set of points
:points \(\{x_i,y_i,z_i\}_{1\leq i \leq n}\). This interpolation is
relies on the Delaunay triangulation of \(\{x_i,y_i\}_{1\leq i \leq n}\)
- class gemseo.post.dataset.zvsxy.ZvsXY(dataset, x, y, z, x_comp=0, y_comp=0, z_comp=0, add_points=False, fill=True, levels=None, other_datasets=None)[source]
Bases:
DatasetPlotPlot surface z versus x,y.
- Parameters:
dataset (Dataset) – The dataset containing the data to plot.
x (str) – The name of the variable on the x-axis.
y (str) – The name of the variable on the y-axis.
z (str) – The name of the variable on the z-axis.
x_comp (int) –
The component of x.
By default it is set to 0.
y_comp (int) –
The component of y.
By default it is set to 0.
z_comp (int) –
The component of z.
By default it is set to 0.
add_points (bool) –
Whether to display the entries of the dataset as points above the surface.
By default it is set to False.
fill (bool) –
Whether to generate a filled contour plot.
By default it is set to True.
levels (int | Sequence[int]) – Either the number of contour lines or the values of the contour lines in increasing order. If
None, select them automatically.other_datasets (Iterable[Dataset]) – Additional datasets to be plotted as points above the surface.
- Raises:
ValueError – If the dataset is empty.
- execute(save=True, show=False, file_path=None, directory_path=None, file_name=None, file_format=None, properties=None, fig=None, axes=None, **plot_options)
Execute the post processing.
- Parameters:
save (bool) –
If True, save the plot.
By default it is set to True.
show (bool) –
If True, display the plot.
By default it is set to False.
file_path (str | Path | None) – The path of the file to save the figures. If None, create a file path from
directory_path,file_nameandfile_format.directory_path (str | Path | None) – The path of the directory to save the figures. If None, use the current working directory.
file_name (str | None) – The name of the file to save the figures. If None, use a default one generated by the post-processing.
file_format (str | None) – A file format, e.g. ‘png’, ‘pdf’, ‘svg’, … If None, use a default file extension.
properties (Mapping[str, DatasetPlotPropertyType] | None) – The general properties of a
DatasetPlot.fig (None | Figure) – The figure to plot the data. If
None, create a new one.axes (None | Axes) – The axes to plot the data. If
None, create new ones.**plot_options – The options of the current class inheriting from
DatasetPlot.
- Returns:
The figures.
- Raises:
AttributeError – When the name of a property is not the name of an attribute.
- Return type:
list[Figure]