gantt_chart module
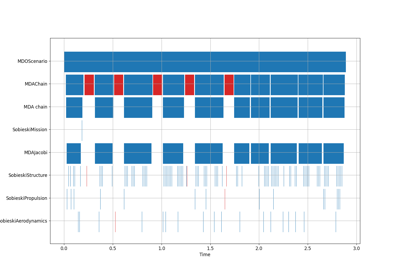
Generate a gantt chart with processes execution time data.
- gemseo.post.core.gantt_chart.create_gantt_chart(file_path='gantt_chart', save=True, show=False, file_extension=None, fig_size=(15.0, 10.0), font_size=12, disc_names=None)[source]
Generate a gantt chart with processes execution time data.
The disciplines names are used as labels and plotted on rows. The x labels are the execution start and end times of all disciplines.
Both executions and linearizations times are plotted.
Warning
MDODiscipline.activate_time_stamps()must be called first.- Parameters:
file_path (str | Path) –
The path to save the figure.
By default it is set to “gantt_chart”.
save (bool) –
Whether to save the figure.
By default it is set to True.
show (bool) –
Whether to show the figure.
By default it is set to False.
file_extension (str | None) – A file extension, e.g. ‘png’, ‘pdf’, ‘svg’, … If
None, use the default file extension.fig_size (tuple[float, float]) –
The figure size.
By default it is set to (15.0, 10.0).
font_size (int) –
The size of the fonts in the plot.
By default it is set to 12.
disc_names (Sequence[str] | None) – The names of the disciplines to plot. If
None, plot all the disciplines for which time stamps exist.
- Returns:
The matplotlib figure.
- Raises:
ValueError – If the time stamps is not activated or if a discipline has no time stamps.
- Return type:
plt.Figure