Note
Click here to download the full example code
ZvsXY
from __future__ import annotations

from gemseo.api import configure_logger
from gemseo.api import load_dataset
from gemseo.post.dataset.zvsxy import ZvsXY

configure_logger()
<RootLogger root (INFO)>
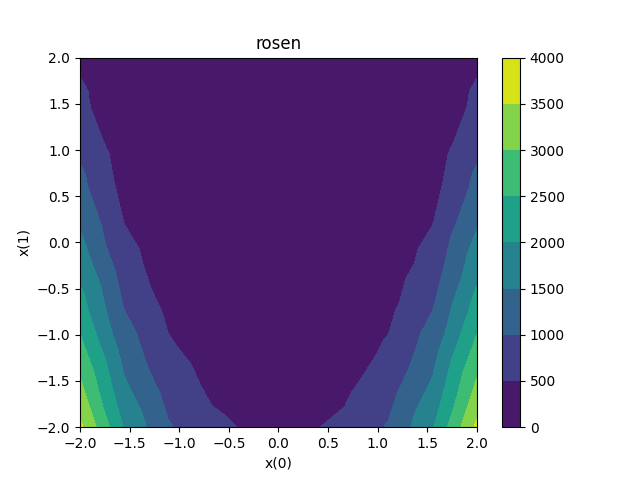
Load the Rosenbrock dataset
dataset = load_dataset("RosenbrockDataset")
Plot z vs x and y
We can use the ZvsXY plot
plot = ZvsXY(dataset, x="x", y="x", y_comp=1, z="rosen")
plot.colormap = "viridis"
plot.execute(save=False, show=True)
[<Figure size 640x480 with 2 Axes>]
Total running time of the script: ( 0 minutes 0.181 seconds)