Note
Click here to download the full example code
Generate an N2 and XDSM from an Excel description of the MDO problem
from __future__ import annotations

from os import mkdir
from os.path import exists
from os.path import join

from gemseo.api import configure_logger
from gemseo.utils.study_analysis import StudyAnalysis

configure_logger()
<RootLogger root (INFO)>
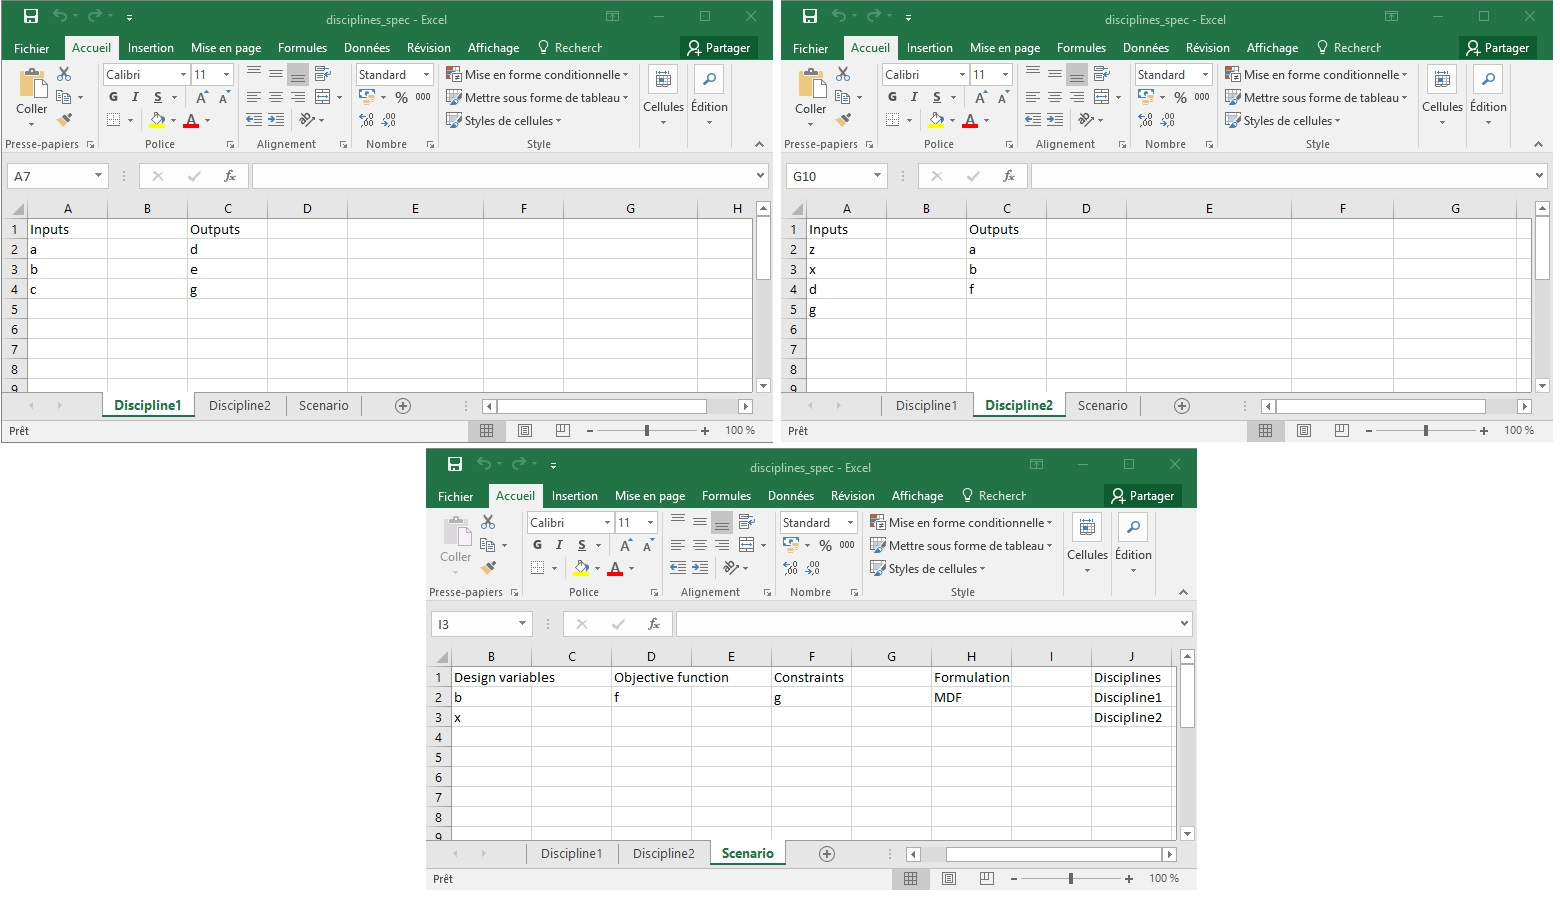
Describe your MDO problem in an Excel file
Visualize this study
study = StudyAnalysis("disciplines_spec.xlsx")
if not exists("outputs"):
    mkdir("outputs")
INFO - 16:59:52: 2 disciplines detected
INFO - 16:59:52:    Discipline1
INFO - 16:59:52:       Inputs: a, b, c
INFO - 16:59:52:       Outputs: d, e, g
INFO - 16:59:52:    Discipline2
INFO - 16:59:52:       Inputs: d, g, x, z
INFO - 16:59:52:       Outputs: a, b, f
INFO - 16:59:52: 1 scenario detected
INFO - 16:59:52:    Scenario
INFO - 16:59:52:       Objectives: f
INFO - 16:59:52:       Disciplines: Discipline1, Discipline2
INFO - 16:59:52:       Constraints: g
INFO - 16:59:52:       Design variables: x
INFO - 16:59:52:       Formulation: MDF
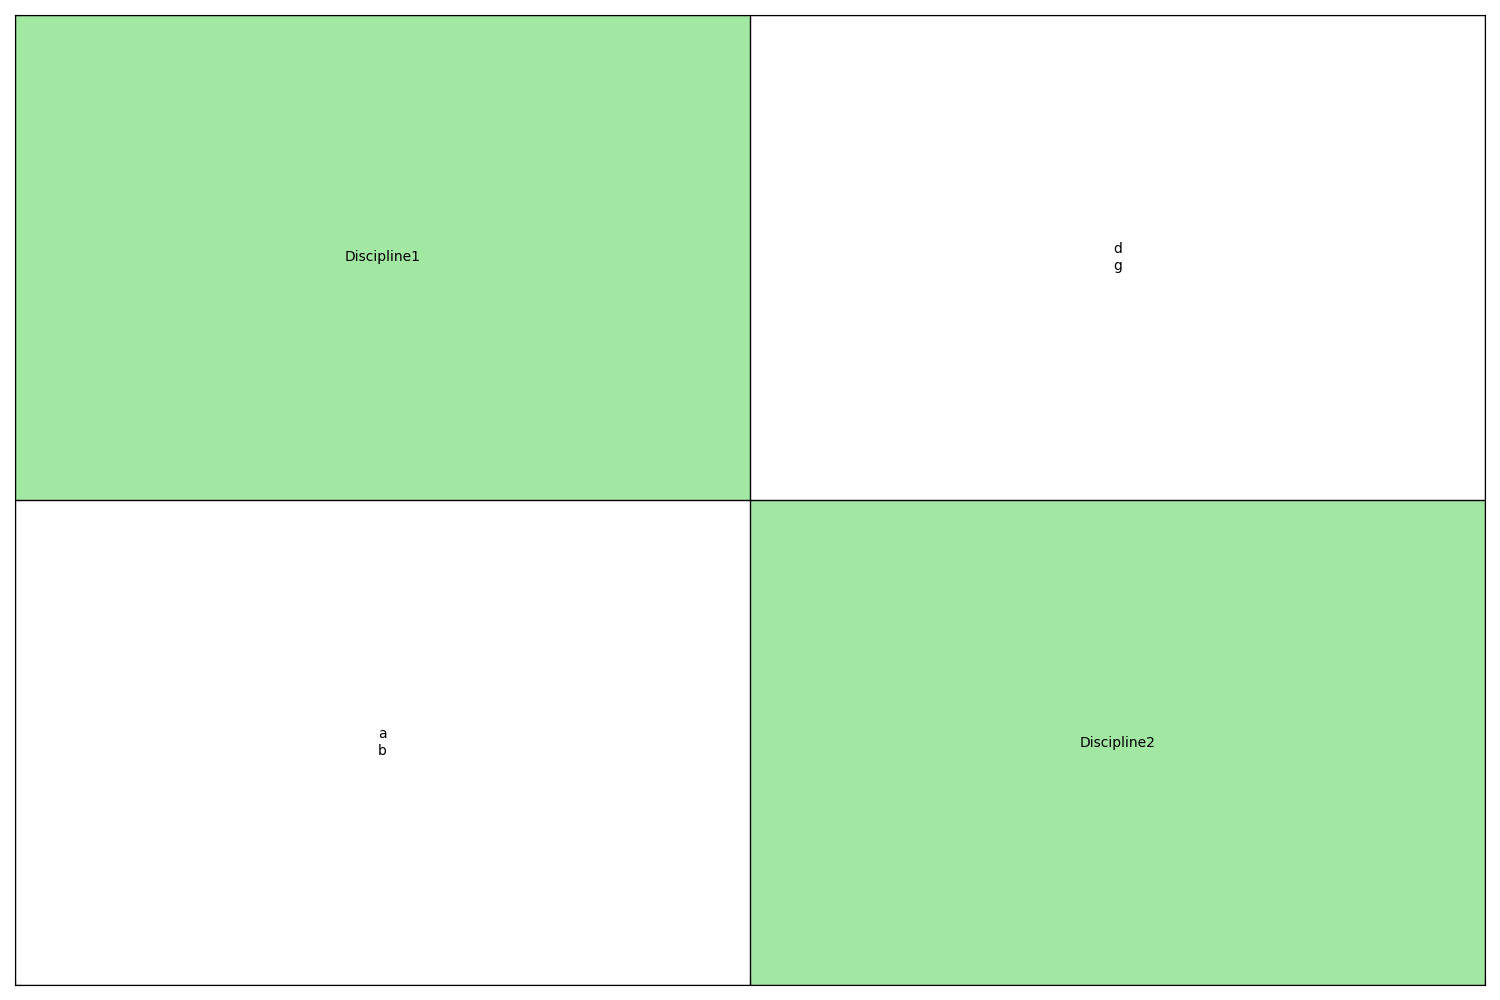
Generate N2 chrt
study.generate_n2(file_path=join("outputs", "n2.png"), save=False, show=True)
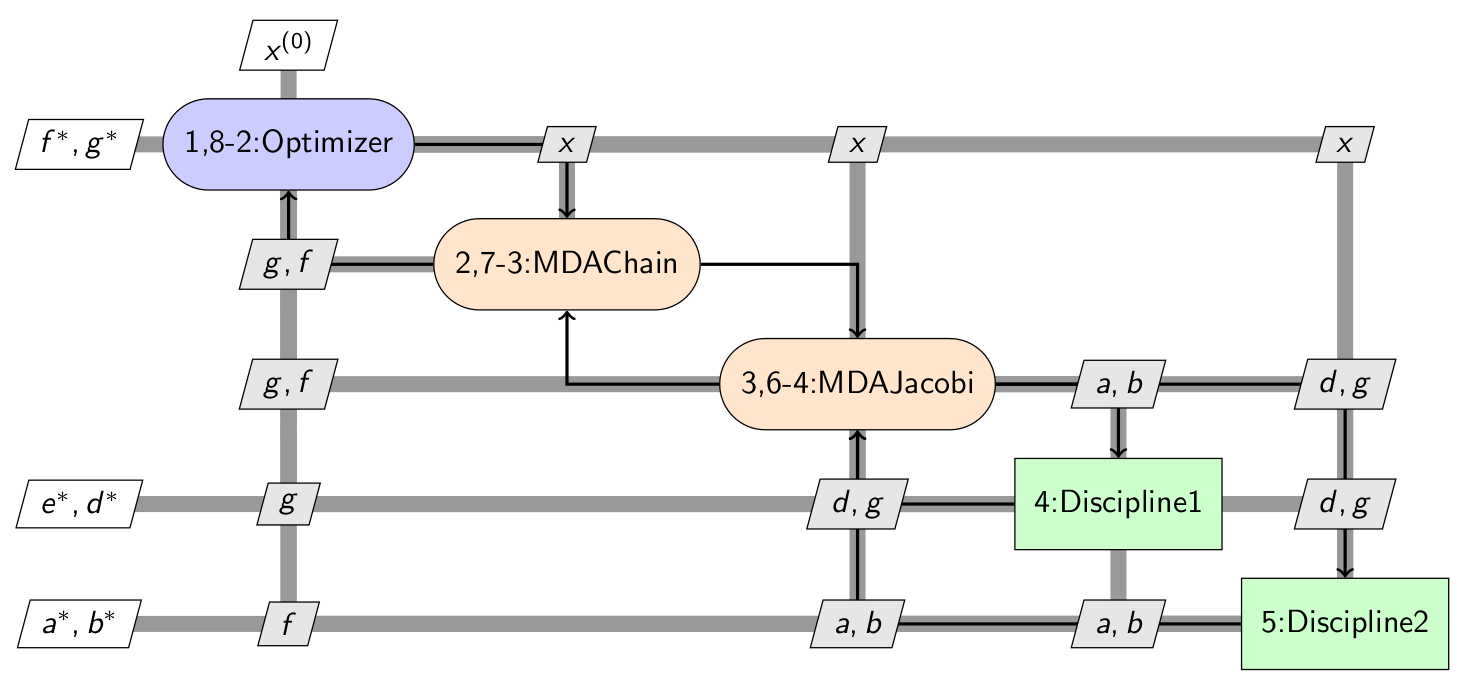
Generate XDSM
study.generate_xdsm("outputs")
    INFO - 16:59:52: Generated the following Scenario:
    INFO - 16:59:52: MDOScenario
    INFO - 16:59:52: Optimization problem:
    INFO - 16:59:52:    minimize f(x)
    INFO - 16:59:52:    with respect to x
    INFO - 16:59:52:    subject to constraints:
    INFO - 16:59:52:       g(x) == 0.0
    INFO - 16:59:52: Generating HTML XDSM file in : outputs/xdsm.html

MDOScenario
   Disciplines: Discipline1 Discipline2
   MDO formulation: MDF
Visualize this study from command line
We can create the same figures using command line inputs:
gemseo-study disciplines_spec.xlsx -o outputs -s '(5,5)' -x -l
where:
gemseo-studyis an executable provided by GEMSEO,disciplines_spec.xlsxis the Excel file path,-o outputsis the output directory,-s '(5,5)'is the size of the N2 chart,-xis an option to create of the XDSM,-lis an option to create a PDF file with the creation of the XDSM.
Total running time of the script: ( 0 minutes 0.319 seconds)