gemseo /
post /
datasetShow inherited members
curves module
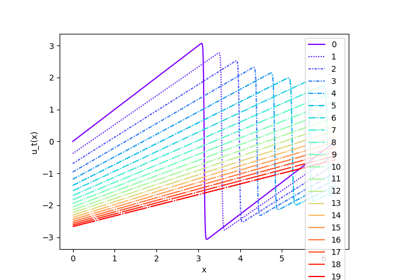
Draw curves from a Dataset.
A Curves plot represents samples of a functional variable
\(y(x)\) discretized over a 1D mesh. Both evaluations of \(y\)
and mesh are stored in a Dataset, \(y\) as a parameter
and the mesh as a misc.
-
class gemseo.post.dataset.curves.Curves(dataset, mesh, variable, samples=None)[source]
Bases: DatasetPlot
Plot curves y_i over the mesh x.
- Parameters:
dataset (Dataset) – The dataset containing the data to plot.
mesh (str) – The name of the dataset misc corresponding to the mesh.
variable (str) – The name of the variable for the x-axis.
samples (Sequence[int] | None) – The indices of the samples to plot.
If None, plot all the samples.
- Raises:
ValueError – If the dataset is empty.
-
color: str | list[str]
The color(s) for the series.
If empty, use a default one.
-
colormap: str
The color map.
-
dataset: Dataset
The dataset to be plotted.
-
fig_size: FigSizeType
The figure size.
-
font_size: int
The font size.
-
legend_location: str
The location of the legend.
-
linestyle: str | list[str]
The line style(s) for the series.
If empty, use a default one.
-
marker: str | list[str]
The marker(s) for the series.
If empty, use a default one.
-
title: str
The title of the plot.
-
xlabel: str
The label for the x-axis.
-
xmax: float | None
The maximum value on the x-axis.”.
If None, compute it from data.
-
xmin: float | None
The minimum value on the x-axis.
If None, compute it from data.
-
ylabel: str
The label for the y-axis.
-
ymax: float | None
The maximum value on the y-axis.
If None, compute it from data.
-
ymin: float | None
The minimum value on the y-axis.
If None, compute it from data.
-
zlabel: str
The label for the z-axis.
-
zmax: float | None
The maximum value on the z-axis.
If None, compute it from data.
-
zmin: float | None
The minimum value on the z-axis.
If None, compute it from data.