lines module
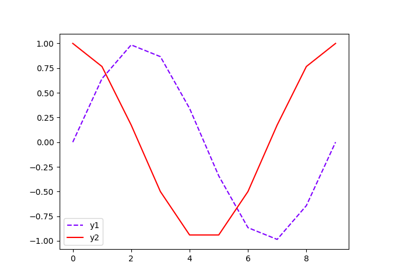
Connect the observations of variables stored in a Dataset with lines.
- class gemseo.post.dataset.lines.Lines(dataset, variables=None, abscissa_variable=None, add_markers=False, set_xticks_from_data=False)[source]
Bases:
DatasetPlotConnect the observations of variables with lines.
- Parameters:
dataset (Dataset) – The dataset containing the data to plot.
variables (Sequence[str] | None) – The names of the variables to plot. If
None, use all the variables.abscissa_variable (str | None) – The name of the variable used in abscissa. The observations of the
variablesare plotted in function of the observations of thisabscissa_variable. IfNone, the observations of thevariablesare plotted in function of the indices of the observations.add_markers (bool) –
Whether to mark the observations with dots.
By default it is set to False.
set_xticks_from_data (bool) –
Whether to use the values of
abscissa_variableas locations of abscissa ticks.By default it is set to False.
- Raises:
ValueError – If the dataset is empty.
- colormap: str
The color map.
- dataset: Dataset
The dataset to be plotted.
- fig_size: FigSizeType
The figure size.
- font_size: int
The font size.
- legend_location: str
The location of the legend.
- title: str
The title of the plot.
- xlabel: str
The label for the x-axis.
- ylabel: str
The label for the y-axis.
- zlabel: str
The label for the z-axis.