radar_chart module
Draw a radar chart from a Dataset.
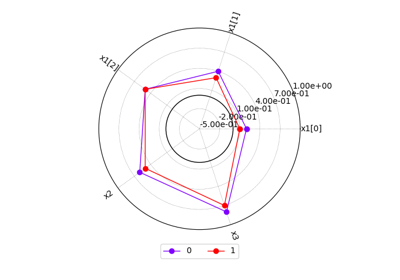
- class gemseo.post.dataset.radar_chart.RadarChart(dataset, display_zero=True, connect=False, radial_ticks=False, n_levels=6, scientific_notation=True)[source]
Bases:
DatasetPlotRadar Chart visualization.
- Parameters:
dataset (Dataset) – The dataset containing the data to plot.
display_zero (bool) –
Whether to display the line where the output is equal to zero.
By default it is set to True.
connect (bool) –
Whether to connect the elements of a series with a line.
By default it is set to False.
radial_ticks (bool) –
Whether to align the ticks names with the radius.
By default it is set to False.
n_levels (int) –
The number of grid levels.
By default it is set to 6.
scientific_notation (bool) –
Whether to format the grid levels with the scientific notation.
By default it is set to True.
- Raises:
ValueError – If the dataset is empty.
- colormap: str
The color map.
- dataset: Dataset
The dataset to be plotted.
- fig_size: FigSizeType
The figure size.
- font_size: int
The font size.
- legend_location: str
The location of the legend.
- title: str
The title of the plot.
- xlabel: str
The label for the x-axis.
- ylabel: str
The label for the y-axis.
- zlabel: str
The label for the z-axis.