scatter module
Draw a scatter plot from a Dataset.
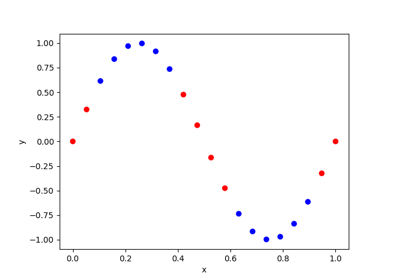
A Scatter plot represents a set of points
\(\{x_i,y_i\}_{1\leq i \leq n}\) as markers on a classical plot
where the color of points can be heterogeneous.
- class gemseo.post.dataset.scatter.Scatter(dataset, x, y)[source]
Bases:
DatasetPlotPlot curve y versus x.
- Parameters:
dataset (Dataset) – The dataset containing the data to plot.
x (VariableType) – The name of the variable on the x-axis, with its optional component if not
0, e.g.("foo", 3)for the fourth component of the variable"foo".y (VariableType) – The name of the variable on the y-axis, with its optional component if not
0, e.g.("bar", 3)for the fourth component of the variable"bar".
- Raises:
ValueError – If the dataset is empty.
- colormap: str
The color map.
- dataset: Dataset
The dataset to be plotted.
- fig_size: FigSizeType
The figure size.
- font_size: int
The font size.
- legend_location: str
The location of the legend.
- title: str
The title of the plot.
- xlabel: str
The label for the x-axis.
- ylabel: str
The label for the y-axis.
- zlabel: str
The label for the z-axis.