scatter_plot_matrix module
Draw a scatter matrix from a Dataset.
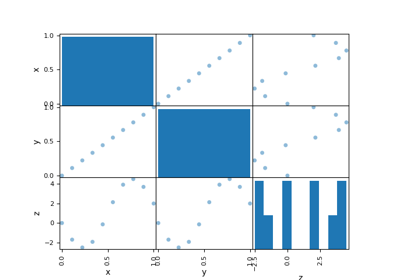
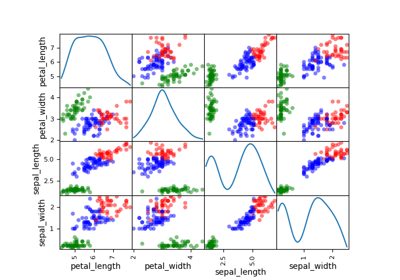
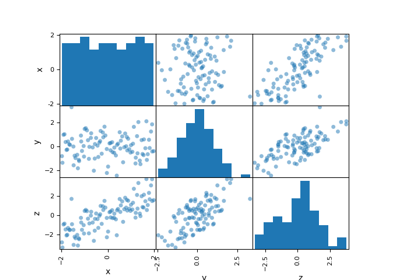
The ScatterMatrix class implements the scatter plot matrix,
which is a way to visualize \(n\) samples of a
multi-dimensional vector
in several 2D subplots where the (i,j) subplot represents the cloud of points
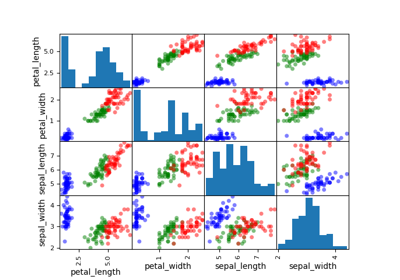
while the (i,i) subplot represents the empirical distribution of the samples
by means of an histogram or a kernel density estimator.
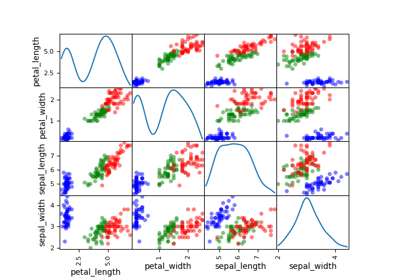
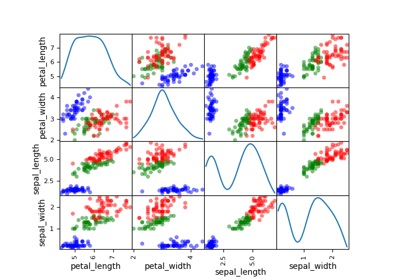
A variable name can be passed to the DatasetPlot.execute() method
by means of the classifier keyword in order to color the curves
according to the value of the variable name. This is useful when the data is
labeled.
- class gemseo.post.dataset.scatter_plot_matrix.ScatterMatrix(dataset, variable_names=None, classifier=None, kde=False, size=25, marker='o', plot_lower=True, plot_upper=True)[source]
Bases:
DatasetPlotScatter plot matrix.
- Parameters:
dataset (Dataset) – The dataset containing the data to plot.
variable_names (Sequence[str] | None) – The description is missing.
classifier (str | None) – The name of the variable to build the cluster.
kde (bool) –
The type of the distribution representation. If True, plot kernel-density estimator on the diagonal. Otherwise, use histograms.
By default it is set to False.
size (int) –
The size of the points.
By default it is set to 25.
marker (str) –
The marker for the points.
By default it is set to “o”.
plot_lower (bool) –
Whether to plot the lower part.
By default it is set to True.
plot_upper (bool) –
Whether to plot the upper part.
By default it is set to True.
- Raises:
ValueError – If the dataset is empty.
- colormap: str
The color map.
- dataset: Dataset
The dataset to be plotted.
- fig_size: FigSizeType
The figure size.
- font_size: int
The font size.
- legend_location: str
The location of the legend.
- title: str
The title of the plot.
- xlabel: str
The label for the x-axis.
- ylabel: str
The label for the y-axis.
- zlabel: str
The label for the z-axis.