Note
Go to the end to download the full example code
Rosenbrock dataset
This Dataset contains 100 evaluations
of the well-known Rosenbrock function:
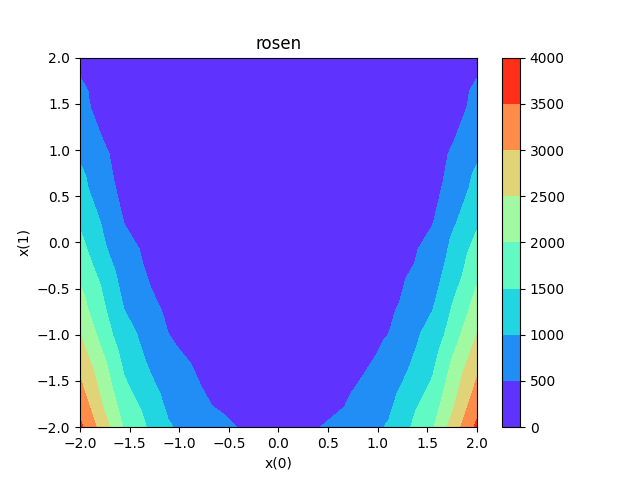
\[f(x,y)=(1-x)^2+100(y-x^2)^2\]
This function is known for its global minimum at point (1,1), its banana valley and the difficulty to reach its minimum.
This Dataset is based on a full-factorial
design of experiments.
More information about the Rosenbrock function
from __future__ import annotations

from gemseo import configure_logger
from gemseo import create_benchmark_dataset
from gemseo.post.dataset.yvsx import YvsX
from gemseo.post.dataset.zvsxy import ZvsXY

configure_logger()
<RootLogger root (INFO)>
Load Rosenbrock dataset
We can easily load this dataset
by means of the high-level function create_benchmark_dataset():
dataset = create_benchmark_dataset("RosenbrockDataset")
print(dataset)
GROUP       designs        objectives
VARIABLE          x             rosen
COMPONENT         0    1            0
1         -2.000000 -2.0  3609.000000
2         -1.555556 -2.0  1959.952599
3         -1.111111 -2.0  1050.699741
4         -0.666667 -2.0   600.308642
5         -0.222222 -2.0   421.490779
..              ...  ...          ...
96         0.222222  2.0   381.095717
97         0.666667  2.0   242.086420
98         1.111111  2.0    58.600975
99         1.555556  2.0    17.927907
100        2.000000  2.0   401.000000

[100 rows x 3 columns]
Show the design data
print(dataset.design_dataset)
GROUP       designs
VARIABLE          x
COMPONENT         0    1
1         -2.000000 -2.0
2         -1.555556 -2.0
3         -1.111111 -2.0
4         -0.666667 -2.0
5         -0.222222 -2.0
..              ...  ...
96         0.222222  2.0
97         0.666667  2.0
98         1.111111  2.0
99         1.555556  2.0
100        2.000000  2.0

[100 rows x 2 columns]
Show the objective data
print(dataset.objective_dataset)
GROUP       objectives
VARIABLE         rosen
COMPONENT            0
1          3609.000000
2          1959.952599
3          1050.699741
4           600.308642
5           421.490779
..                 ...
96          381.095717
97          242.086420
98           58.600975
99           17.927907
100         401.000000

[100 rows x 1 columns]
Load the data with an input-output naming
dataset = create_benchmark_dataset("RosenbrockDataset", opt_naming=False)
print(dataset)
GROUP        inputs           outputs
VARIABLE          x             rosen
COMPONENT         0    1            0
0         -2.000000 -2.0  3609.000000
1         -1.555556 -2.0  1959.952599
2         -1.111111 -2.0  1050.699741
3         -0.666667 -2.0   600.308642
4         -0.222222 -2.0   421.490779
..              ...  ...          ...
95         0.222222  2.0   381.095717
96         0.666667  2.0   242.086420
97         1.111111  2.0    58.600975
98         1.555556  2.0    17.927907
99         2.000000  2.0   401.000000

[100 rows x 3 columns]
Plot the data
ZvsXY(dataset, x=("x", 0), y=("x", 1), z="rosen").execute(save=False, show=True)
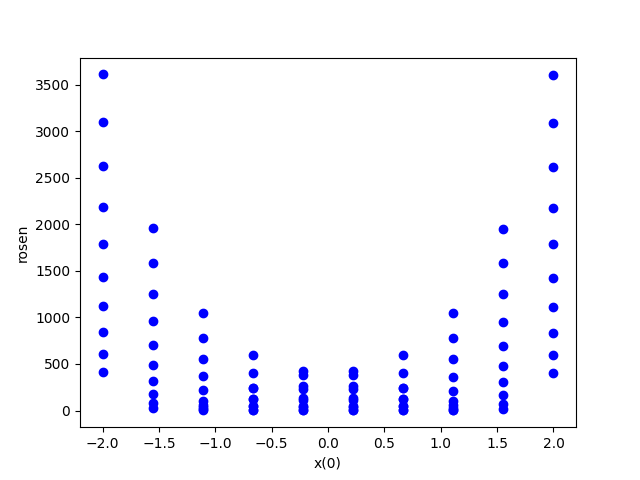
YvsX(dataset, x=("x", 0), y="rosen").execute(save=False, show=True)
[<Figure size 640x480 with 1 Axes>]
Total running time of the script: ( 0 minutes 0.389 seconds)