gemseo /
post /
datasetShow inherited members
bars module
Draw a bar plot from a Dataset.
-
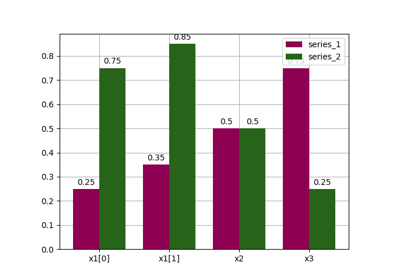
class gemseo.post.dataset.bars.BarPlot(dataset, n_digits=1)[source]
Bases: DatasetPlot
Barplot visualization.
- Parameters:
dataset (Dataset) – The dataset containing the data to plot.
n_digits (int) –
The number of digits to print the different bar values.
By default it is set to 1.
- Raises:
ValueError – If the dataset is empty.
-
color: str | list[str]
The color(s) for the series.
If empty, use a default one.
-
colormap: str
The color map.
-
dataset: Dataset
The dataset to be plotted.
-
fig_size: FigSizeType
The figure size.
-
font_size: int
The font size.
-
legend_location: str
The location of the legend.
-
linestyle: str | list[str]
The line style(s) for the series.
If empty, use a default one.
-
marker: str | list[str]
The marker(s) for the series.
If empty, use a default one.
-
title: str
The title of the plot.
-
xlabel: str
The label for the x-axis.
-
xmax: float | None
The maximum value on the x-axis.”.
If None, compute it from data.
-
xmin: float | None
The minimum value on the x-axis.
If None, compute it from data.
-
xtick_rotation: float
The rotation angle in degrees for the x-ticks.
-
ylabel: str
The label for the y-axis.
-
ymax: float | None
The maximum value on the y-axis.
If None, compute it from data.
-
ymin: float | None
The minimum value on the y-axis.
If None, compute it from data.
-
zlabel: str
The label for the z-axis.
-
zmax: float | None
The maximum value on the z-axis.
If None, compute it from data.
-
zmin: float | None
The minimum value on the z-axis.
If None, compute it from data.