lines module
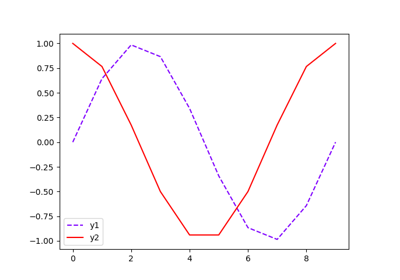
Connect the observations of variables stored in a Dataset with lines.
- class gemseo.post.dataset.lines.Lines(dataset, variables=None, abscissa_variable=None, add_markers=False, set_xticks_from_data=False)[source]
Bases:
DatasetPlotConnect the observations of variables with lines.
- Parameters:
dataset (Dataset) – The dataset containing the data to plot.
variables (Sequence[str] | None) – The names of the variables to plot. If
None, use all the variables.abscissa_variable (str | None) – The name of the variable used in abscissa. The observations of the
variablesare plotted in function of the observations of thisabscissa_variable. IfNone, the observations of thevariablesare plotted in function of the indices of the observations.add_markers (bool) –
Whether to mark the observations with dots.
By default it is set to False.
set_xticks_from_data (bool) –
Whether to use the values of
abscissa_variableas locations of abscissa ticks.By default it is set to False.
- Raises:
ValueError – If the dataset is empty.
- execute(save=True, show=False, file_path='', directory_path=None, file_name=None, file_format=None, properties=None, fig=None, axes=None, **plot_options)
Execute the post-processing.
- Parameters:
save (bool) –
If
True, save the plot.By default it is set to True.
show (bool) –
If
True, display the plot.By default it is set to False.
file_path (str | Path) –
The path of the file to save the figures. If empty, create a file path from
directory_path,file_nameandfile_format.By default it is set to “”.
directory_path (str | Path | None) – The path of the directory to save the figures. If
None, use the current working directory.file_name (str | None) – The name of the file to save the figures. If
None, use a default one generated by the post-processing.file_format (str | None) – A file format, e.g. ‘png’, ‘pdf’, ‘svg’, … If
None, use a default file extension.properties (Mapping[str, DatasetPlotPropertyType] | None) – The general properties of a
DatasetPlot.fig (None | Figure) – The figure to plot the data. If
None, create a new one.axes (None | Axes) – The axes to plot the data. If
None, create new ones.**plot_options – The options of the current class inheriting from
DatasetPlot.
- Returns:
The figures.
- Raises:
AttributeError – When the name of a property is not the name of an attribute.
- Return type:
list[Figure]
- fig_size: FigSizeType
The figure size.