gemseo /
post /
datasetHide inherited members
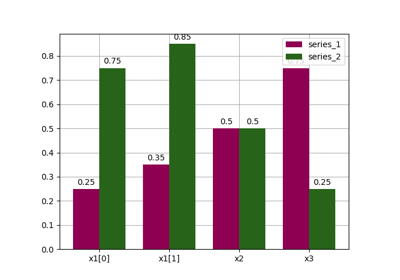
bars module
Draw a bar plot from a Dataset.
-
class gemseo.post.dataset.bars.BarPlot(dataset, n_digits=1)[source]
Bases: DatasetPlot
Barplot visualization.
- Parameters:
dataset (Dataset) – The dataset containing the data to plot.
n_digits (int) –
The number of digits to print the different bar values.
By default it is set to 1.
- Raises:
ValueError – If the dataset is empty.
-
class PlotEngine(value)
Bases: StrEnum
An engine of plots.
-
MATPLOTLIB = 'MatplotlibPlotFactory'
-
PLOTLY = 'PlotlyPlotFactory'
-
execute(save=True, show=False, file_path='', directory_path=None, file_name=None, file_format='png', file_name_suffix='', **engine_parameters)
Execute the post-processing.
- Parameters:
save (bool) –
If True, save the plot.
By default it is set to True.
show (bool) –
If True, display the plot.
By default it is set to False.
file_path (str | Path) –
The path of the file to save the figures.
If empty,
create a file path
from directory_path, file_name and file_format.
By default it is set to “”.
directory_path (str | Path | None) – The path of the directory to save the figures.
If None, use the current working directory.
file_name (str | None) – The name of the file to save the figures.
If None, use a default one generated by the post-processing.
file_format (str) –
A file format, e.g. ‘png’, ‘pdf’, ‘svg’, …
By default it is set to “png”.
file_name_suffix (str) –
The suffix to be added to the file name.
By default it is set to “”.
**engine_parameters (Any) – The parameters specific to the plot engine.
- Returns:
The figures.
- Return type:
list[Figure]
-
DEFAULT_PLOT_ENGINE: ClassVar[PlotEngine] = 'MatplotlibPlotFactory'
The default engine of plots.
-
FILE_FORMATS_TO_PLOT_ENGINES: ClassVar[dict[str, PlotEngine]] = {'html': PlotEngine.PLOTLY}
The file formats bound to the engines of plots.
The method execute() uses this dictionary
to select the engine of plots associated with its file_format argument.
If missing, the method uses the DEFAULT_PLOT_ENGINE.
-
property color: str | list[str]
The colors for the series; if empty, use a default one.
-
property colormap: str
The color map.
-
property dataset: Dataset
The dataset.
-
property fig_size: FigSizeType
The figure size.
-
property fig_size_x: float
The x-component of figure size.
-
property fig_size_y: float
The y-component of figure size.
-
property font_size: int
The font size.
-
property labels: Mapping[str, str]
The labels for the variables.
-
property legend_location: str
The location of the legend.
-
property linestyle: str | list[str]
The line style for the series; if empty, use a default one.
-
property marker: str | list[str]
The marker for the series; if empty, use a default one.
-
property output_files: list[str]
The paths to the output files.
-
property rmax: float | None
The maximum value on the r-axis; if None, compute it from data.
-
property rmin: float | None
The minimum value on the r-axis; if None, compute it from data.
-
property title: str
The title of the plot.
-
property xlabel: str
The label for the x-axis.
-
property xmax: float | None
The maximum value on the x-axis; if None, compute it from data.
-
property xmin: float | None
The minimum value on the x-axis; if None, compute it from data.
-
property xtick_rotation: str
The rotation angle in degrees for the x-ticks.
-
property ylabel: str
The label for the y-axis.
-
property ymax: float | None
The maximum value on the y-axis; if None, compute it from data.
-
property ymin: float | None
The minimum value on the y-axis; if None, compute it from data.
-
property zlabel: str
The label for the z-axis.
-
property zmax: float | None
The maximum value on the z-axis; if None, compute it from data.
-
property zmin: float | None
The minimum value on the z-axis; if None, compute it from data.