Note
Go to the end to download the full example code
Generate an N2 from an Excel description of the coupling problem
from __future__ import annotations

from gemseo import configure_logger
from gemseo.utils.study_analyses.coupling_study_analysis import CouplingStudyAnalysis

configure_logger()
<RootLogger root (INFO)>
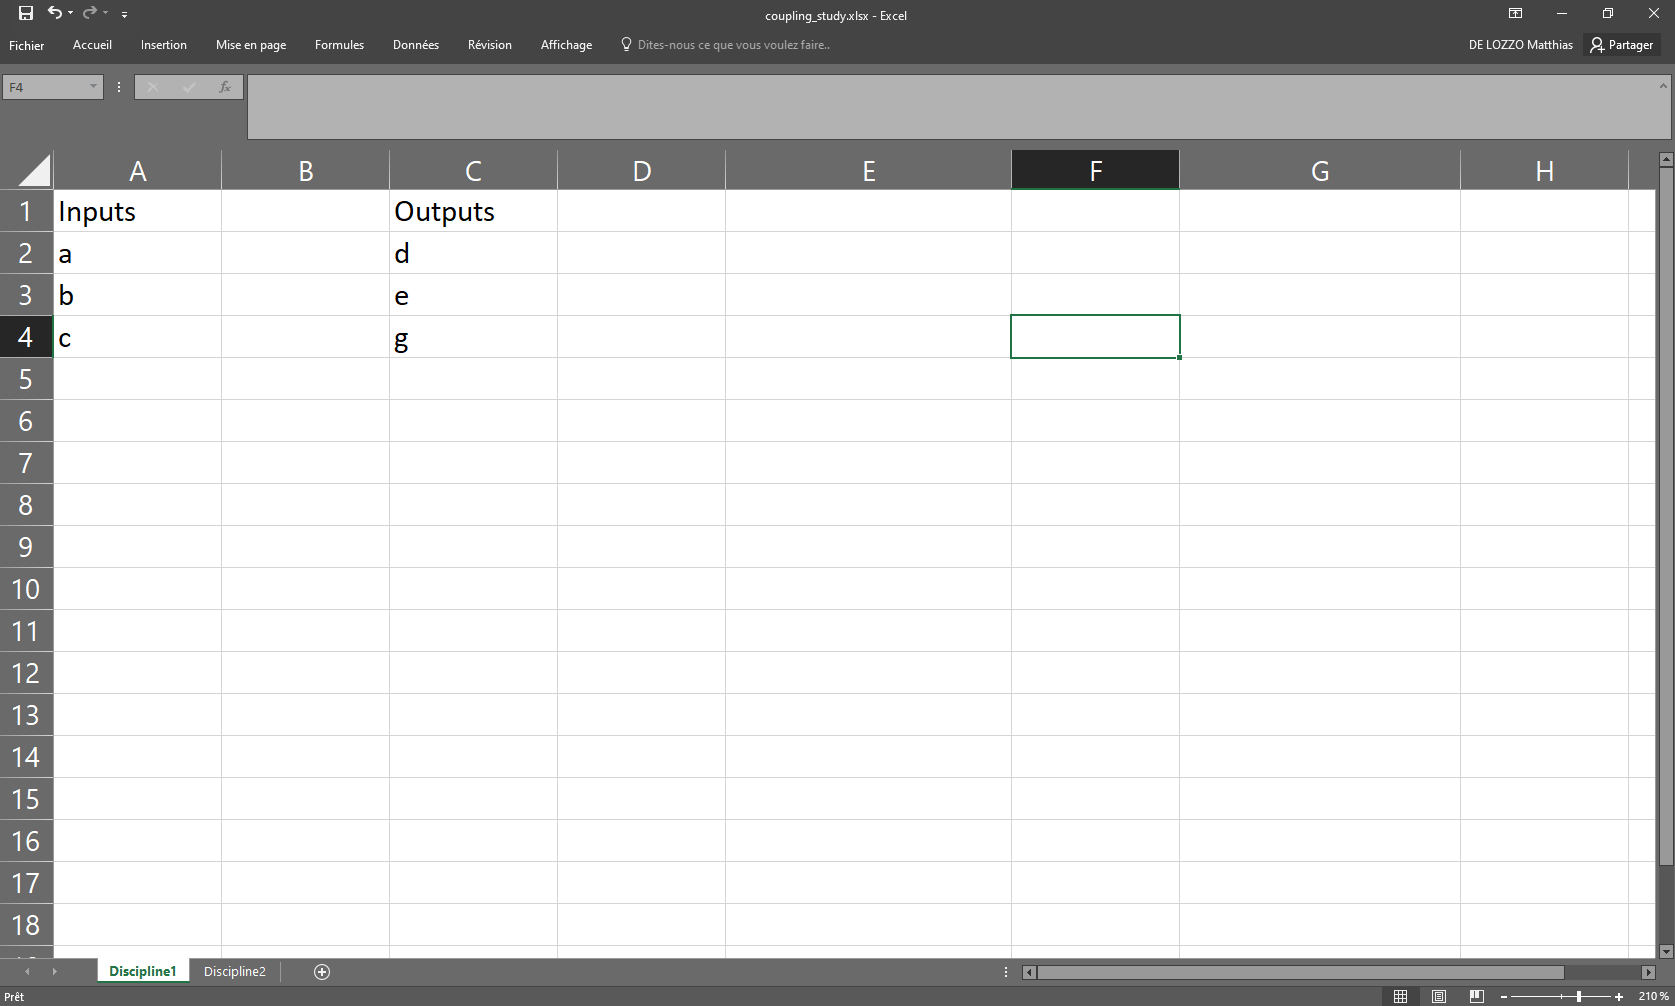
Describe your coupling problem in an Excel file
Visualize this study
study = CouplingStudyAnalysis("coupling_study.xlsx")
study.generate_n2(save=False, show=True)
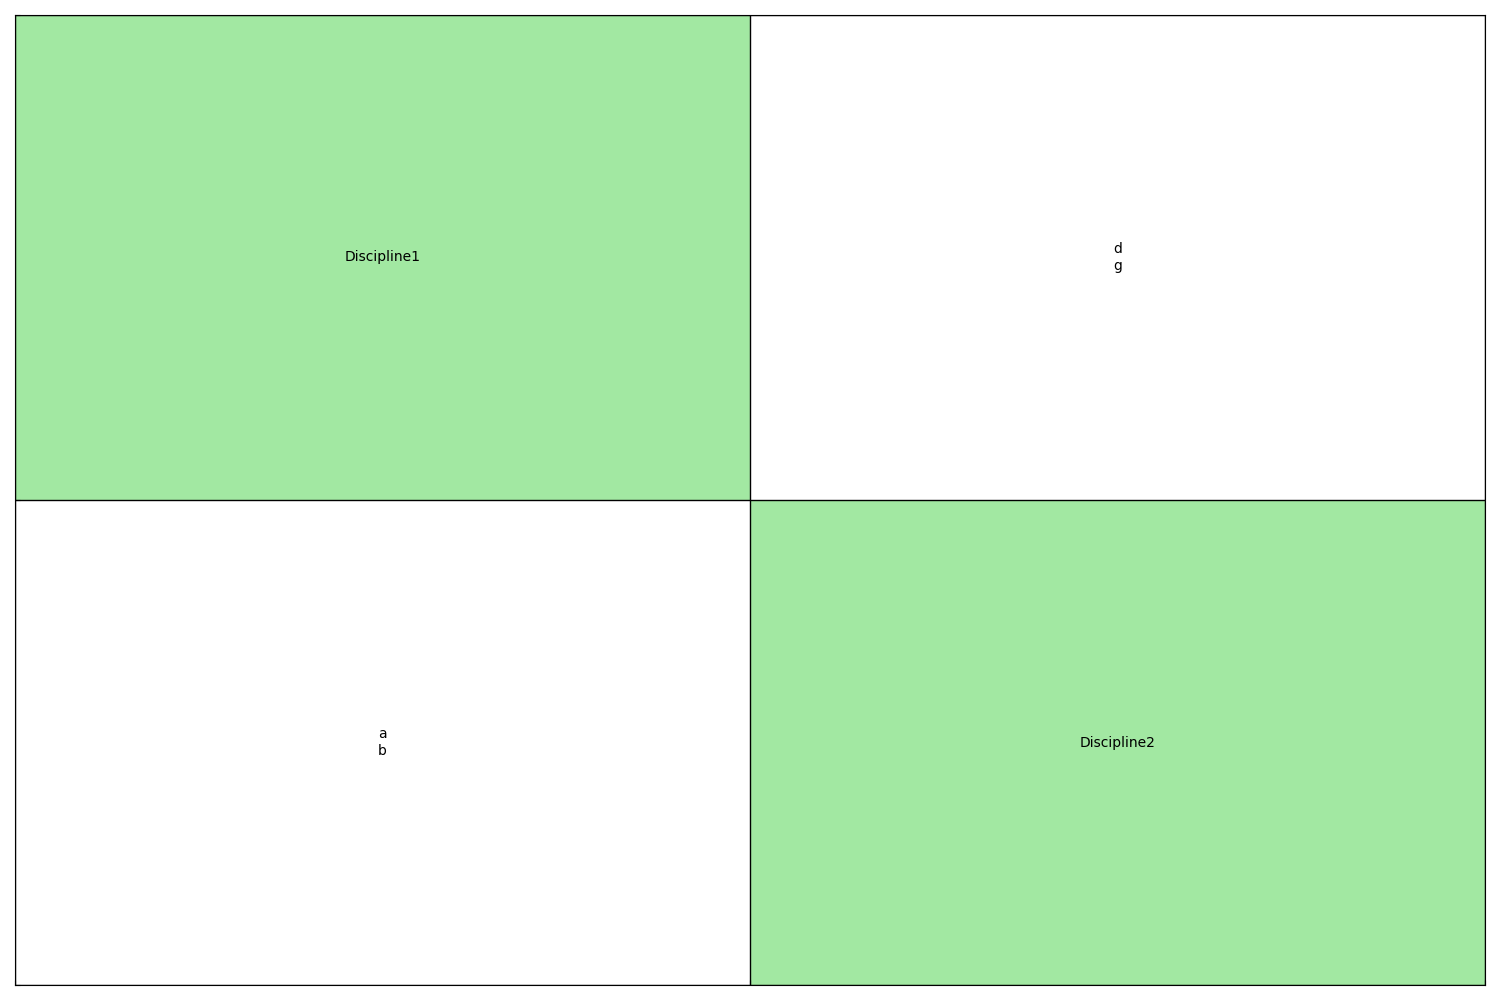
INFO - 13:54:38: 2 disciplines detected
INFO - 13:54:38:    Discipline1
INFO - 13:54:38:       Inputs: a, b, c
INFO - 13:54:38:       Outputs: d, e, g
INFO - 13:54:38:    Discipline2
INFO - 13:54:38:       Inputs: d, g, x, z
INFO - 13:54:38:       Outputs: a, b, f
Visualize this study from the command line
We can create the same figures using command line inputs:
gemseo-study coupling_study.xlsx -t coupling -o outputs --height 5 --width 5
where gemseo-study is an executable provided by GEMSEO
and the Excel file path coupling_study.xlsx is the specification
of the coupling study.
Here, we set some options of gemseo-study:
-t couplingis the type of study (default:mdo),-o outputsis the output directory,--height 5is the height of the N2 chart in inches,--width 5is the width of the N2 chart in inches.
Total running time of the script: (0 minutes 0.203 seconds)