Note
Go to the end to download the full example code.
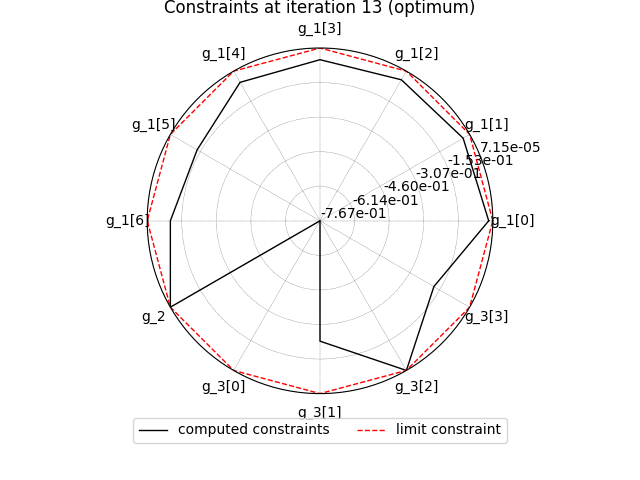
Radar chart#
In this example, we illustrate the use of the RadarChart post-processing
on the Sobieski's SSBJ problem.
The RadarChart post-processing plots the constraints functions specified by
the user, at a given iteration, on a radar style chart.
By default, the last iteration is used. This post-processing of the constraints scales
better with the number of constraints than the constraint plot provided by the
OptHistoryView.
    INFO - 16:25:51: Importing the optimization problem from the file sobieski_mdf_scenario.h5

<gemseo.post.radar_chart.RadarChart object at 0x72a4e0c65520>
from __future__ import annotations

from gemseo import execute_post
from gemseo.settings.post import RadarChart_Settings

execute_post(
    "sobieski_mdf_scenario.h5",
    settings_model=RadarChart_Settings(
        constraint_names=["g_1", "g_2", "g_3"],
        save=False,
        show=True,
    ),
)
Total running time of the script: (0 minutes 0.165 seconds)