Note
Go to the end to download the full example code.
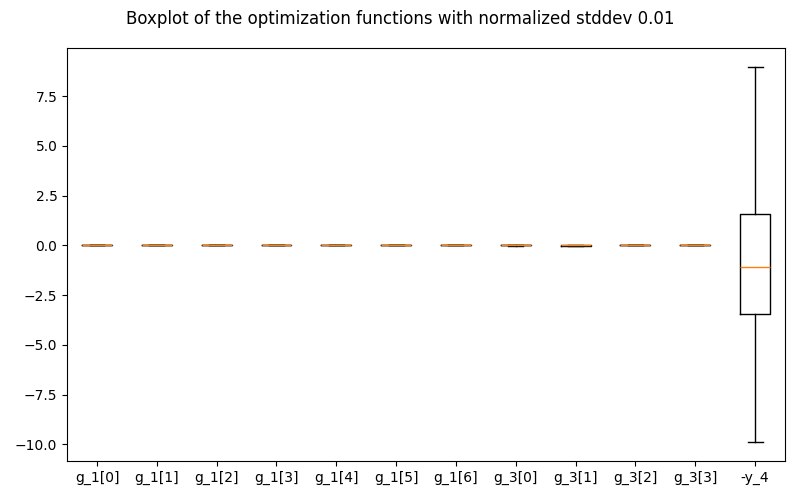
Robustness#
In this example, we illustrate the use of the Robustness plot
on the Sobieski's SSBJ problem.
The Robustness post-processing plots the robustness of the optimum in a box
plot. Using the quadratic approximations of all the output functions, we propagate
analytically a normal distribution with 1% standard deviation on all the design
variables, assuming no cross-correlations of inputs, to obtain the mean and standard
deviation of the resulting normal distribution. A series of samples are randomly
generated from the resulting distribution, whose quartiles are plotted, relatively to
the values of the function at the optimum. For each function (in abscissa), the plot
shows the extreme values encountered in the samples (top and bottom bars). Then, 95% of
the values are within the blue boxes. The average is given by the red bar.
    INFO - 16:25:51: Importing the optimization problem from the file sobieski_mdf_scenario.h5

<gemseo.post.robustness.Robustness object at 0x72a4f251f6b0>
from __future__ import annotations

from gemseo import execute_post
from gemseo.settings.post import Robustness_Settings

execute_post(
    "sobieski_mdf_scenario.h5",
    settings_model=Robustness_Settings(save=False, show=True),
)
Total running time of the script: (0 minutes 0.241 seconds)