yvsx module
Draw a variable versus another from a Dataset.
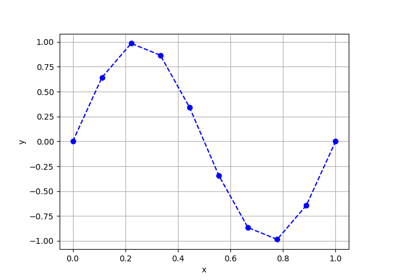
A YvsX plot represents samples of a couple \((x,y)\) as a set of points
whose values are stored in a Dataset. The user can select the style of line or
markers, as well as the color.
- class gemseo.post.dataset.yvsx.YvsX(dataset, x, y)[source]
Bases:
DatasetPlotPlot curve y versus x.
- Parameters:
dataset (Dataset) – The dataset containing the data to plot.
x (VariableType) – The name of the variable on the x-axis, with its optional component if not
0, e.g.("foo", 3)for the fourth component of the variable"foo".y (VariableType) – The name of the variable on the y-axis, with its optional component if not
0, e.g.("bar", 3)for the fourth component of the variable"bar".
- Raises:
ValueError – If the dataset is empty.