Note
Click here to download the full example code
Plot - Lines
from gemseo.api import configure_logger
from gemseo.core.dataset import Dataset
from gemseo.post.dataset.lines import Lines
from matplotlib import pyplot as plt
from numpy import cos
from numpy import linspace
from numpy import pi
from numpy import sin

configure_logger()
Out:
<RootLogger root (INFO)>
Build a dataset
inputs = linspace(0, 1, 10)[:, None]
outputs_1 = sin(2 * pi * inputs)
outputs_2 = cos(2 * pi * inputs)

dataset = Dataset()
dataset.add_variable("x", inputs, "inputs")
dataset.add_variable("y1", outputs_1, "outputs", cache_as_input=False)
dataset.add_variable("y2", outputs_2, "outputs", cache_as_input=False)
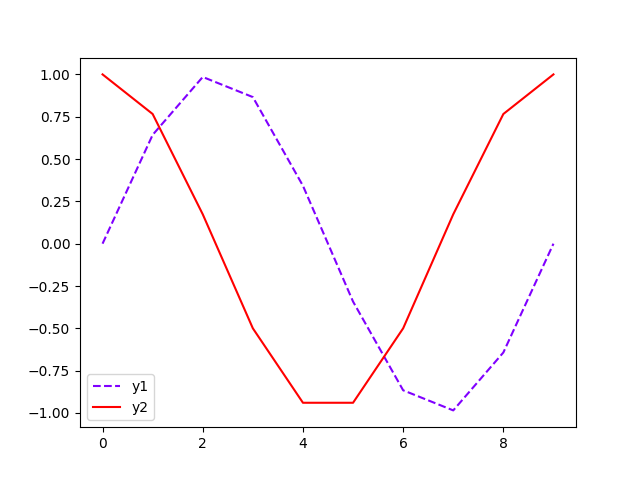
Plot y1 and y2
We can use the Lines plot.
plot = Lines(dataset, variables=["y1", "y2"])
plot.linestyle = ["--", "-"]
plot.execute(save=False, show=False)
# Workaround for HTML rendering, instead of ``show=True``
plt.show()
Total running time of the script: ( 0 minutes 0.131 seconds)