Coupling visualization
GEMSEO offers two ways of visualizing a multidisciplinary coupling structure, either using a network diagram based on nodes and links or using an N2 chart based on a tabular view.
Dependency graph
Both rely on the same DependencyGraph,
built from the library NetworkX.
This DependencyGraph
generates not only the full
directed graph
but also the condensed one
with the Tarjan’s algorithm 1 with Nuutila’s modifications 2.
- 1
Depth-first search and linear graph algorithms, R. Tarjan SIAM Journal of Computing 1(2):146-160, (1972).
- 2
On finding the strongly connected components in a directed graph. E. Nuutila and E. Soisalon-Soinen Information Processing Letters 49(1): 9-14, (1994).
The following example is used to illustrate these features:
from gemseo.api import create_discipline

disc0 = create_discipline('AnalyticDiscipline', name='D0', expressions={'y0':'x0+y1+y2'})
disc1 = create_discipline('AnalyticDiscipline', name='D1', expressions={'y1':'x0+x1+y2'})
disc2 = create_discipline('AnalyticDiscipline', name='D2', expressions={'y2':'x0+x2+y1'})
disciplines = [disc0, disc1, disc2]
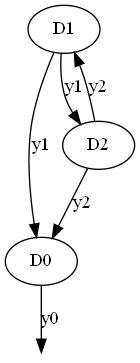
where the disciplines D1 and D2 are strongly coupled while D0 is weakly coupled to D1 and D2.
Coupling graph visualization
Both full and condensed graphs can be represented as network diagrams where disciplines are nodes represented by circles labeled by their names, and couplings are links represented by arrows labeled by their coupling variables.
API
The API function generate_coupling_graph() allows
to create these visualizations and save them, from:
the
MDODisciplineinstances defining the disciplines of interest,a file path (by default, the default current working directory with coupling_graph.pdf as file name),
and the type of graph to display (by default, the full graph).
Full graph
from gemseo.api import generate_coupling_graph

generate_coupling_graph(disciplines)
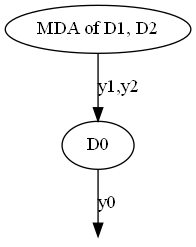
Condensed graph
generate_coupling_graph(disciplines, full=False)
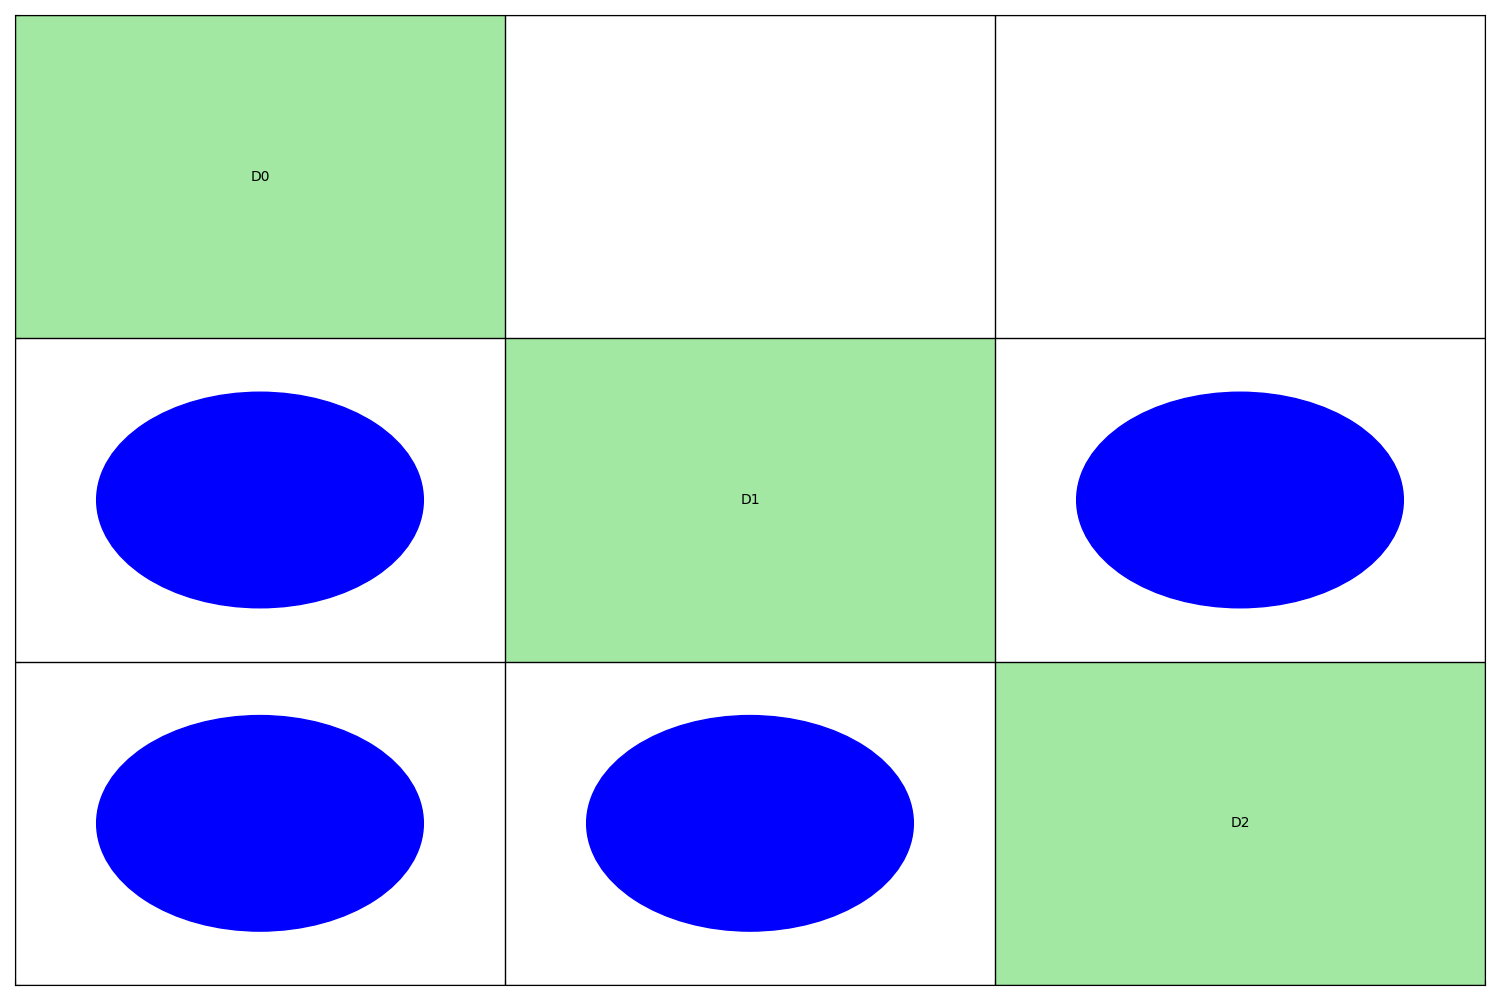
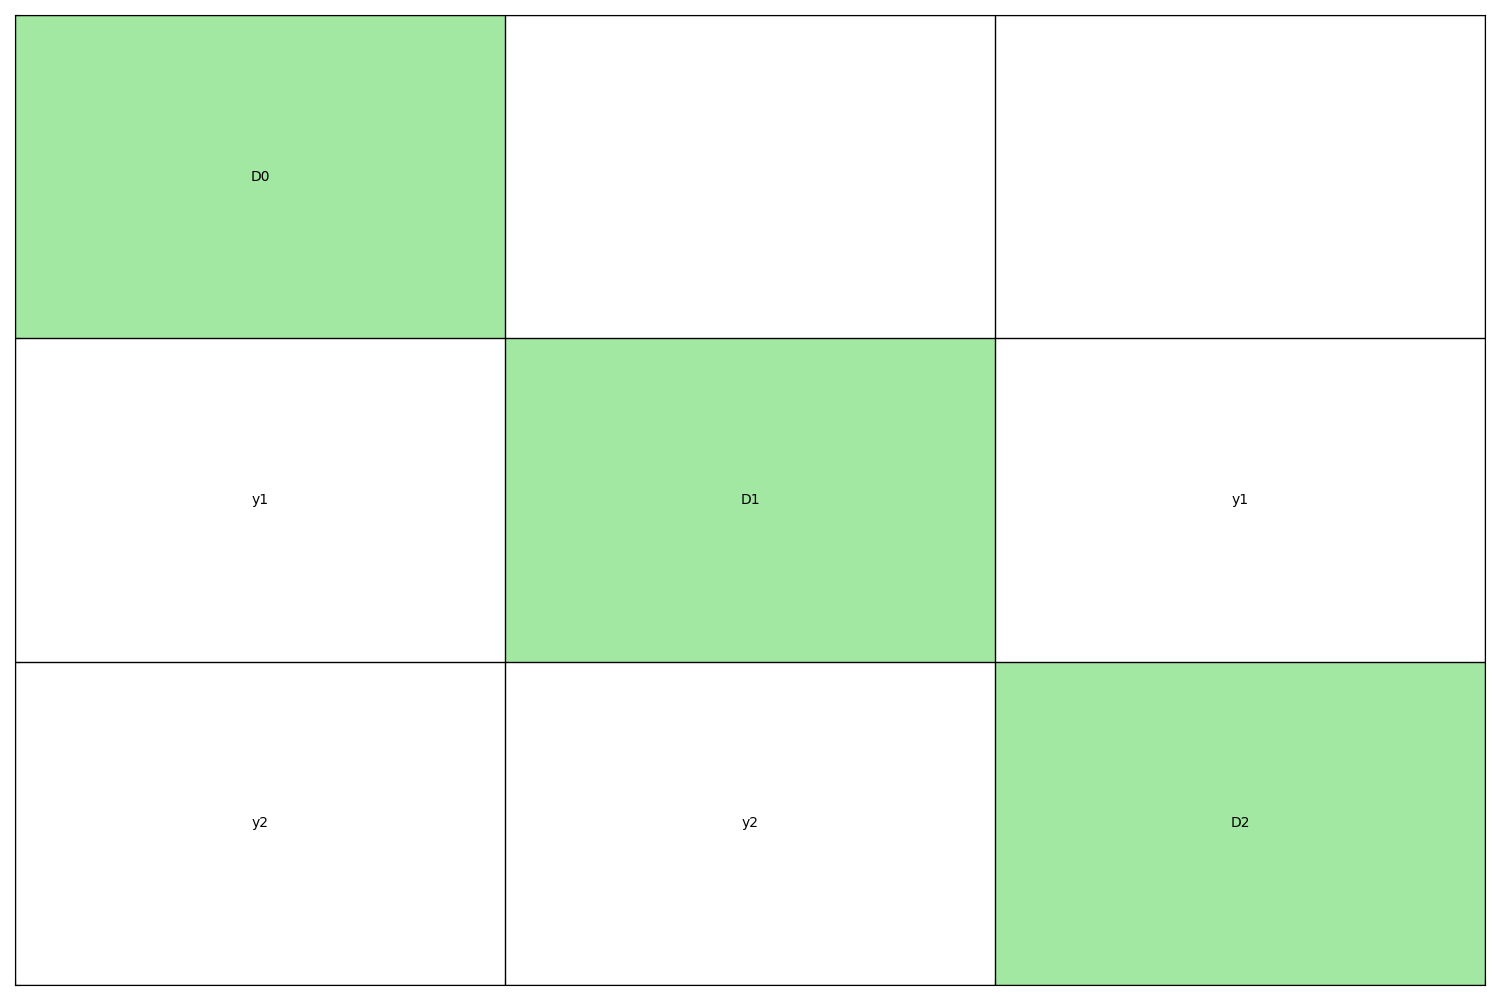
N2 chart visualization
Both full and condensed graphs can be represented as N2 charts also referred to as N2 diagrams, N-squared diagrams or N-squared charts.
The diagonal elements of an N2 chart are the disciplines while the non-diagonal elements are the coupling variables. A discipline takes its inputs vertically and returns its outputs horizontally. In other words, if the cell (i,j) is not empty, its content is the set of the names of the variables computed by the i-th discipline and passed to the j-th discipline.
GEMSEO offers the possibility to display the N2 chart either as a static visualization of the full graph, or as an interactive visualization of both full and condensed graphs:
API
The API function generate_n2_plot() allows
to create these visualizations and save them, from:
the
MDODisciplineinstances defining the disciplines of interest,a file path (by default, the default current working directory with n2.pdf as file name),
whether to display the names of the coupling variables in the static N2 chart (by default, True),
whether to save the static N2 chart (by default, True),
whether to show the static N2 chart in a dedicated window (by default, True),
the size of the figure of the static N2 chart (by default, width equal to 15 and height equal to 10),
and whether to open the default web browser and display the interactive N2 chart (by default, False).
Whatever the options, an HTML file is create based on the provided file path by using .html as file extension (by default, n2.html):
This interactive N2 chart can be opened at any time in a browser
See also
Click here to see the example of an interactive N2 chart with several groups of strongly coupled disciplines
With coupling names
from gemseo.api import generate_n2_plot

generate_n2_plot(disciplines)
Without coupling names
from gemseo.api import generate_n2_plot

generate_n2_plot(disciplines, show_data_names=False)