parallel_coordinates module
Draw parallel coordinates from a Dataset.
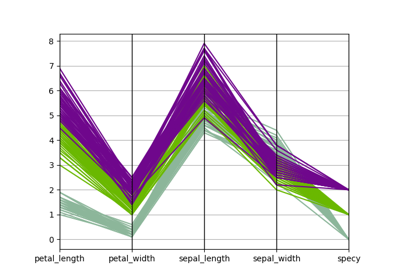
The ParallelCoordinates class implements the parallel coordinates
plot, a.k.a. cowebplot, which is a way to visualize \(n\) samples of a
high-dimensional vector
in a 2D referential by representing each sample
as a piece-wise line where the x-values of the nodes from left to right are the values of \(x_1\), \(x_2\), … and \(x_d^{(i)}\).
A variable name is required by the DatasetPlot.execute() method
by means of the classifier keyword in order to color the curves
according to the value of the variable name. This is useful when the data is
labeled or when we are looking for the samples for which the classifier value
is comprised in some interval specified by the lower and upper
arguments
(default values are set to -inf and inf respectively).
In the latter case, the color scale is composed of only two values: one for
the samples positively classified and one for the others.
- class gemseo.post.dataset.parallel_coordinates.ParallelCoordinates(dataset, classifier, lower=-inf, upper=inf, **kwargs)[source]
Bases:
DatasetPlotParallel coordinates.
- Parameters:
dataset (Dataset) – The dataset containing the data to plot.
classifier (str) – The name of the variable to group the data.
lower (float) –
The lower bound of the cluster.
By default it is set to -inf.
upper (float) –
The upper bound of the cluster.
By default it is set to inf.
**kwargs – The description is missing.
- Raises:
ValueError – If the dataset is empty.
- execute(save=True, show=False, file_path=None, directory_path=None, file_name=None, file_format=None, properties=None, fig=None, axes=None, **plot_options)
Execute the post processing.
- Parameters:
save (bool) –
If True, save the plot.
By default it is set to True.
show (bool) –
If True, display the plot.
By default it is set to False.
file_path (str | Path | None) – The path of the file to save the figures. If None, create a file path from
directory_path,file_nameandfile_format.directory_path (str | Path | None) – The path of the directory to save the figures. If None, use the current working directory.
file_name (str | None) – The name of the file to save the figures. If None, use a default one generated by the post-processing.
file_format (str | None) – A file format, e.g. ‘png’, ‘pdf’, ‘svg’, … If None, use a default file extension.
properties (Mapping[str, DatasetPlotPropertyType] | None) – The general properties of a
DatasetPlot.fig (None | Figure) – The figure to plot the data. If
None, create a new one.axes (None | Axes) – The axes to plot the data. If
None, create new ones.**plot_options – The options of the current class inheriting from
DatasetPlot.
- Returns:
The figures.
- Raises:
AttributeError – When the name of a property is not the name of an attribute.
- Return type:
list[Figure]