Note
Click here to download the full example code
Mixture of experts with PCA on Burgers dataset
In this demo, we apply a mixture of experts regression model to the Burgers dataset. In order to reduce the output dimension, we apply a PCA to the outputs.
Imports
Import from standard libraries and GEMSEO.
from __future__ import annotations

import matplotlib.pyplot as plt
from gemseo.api import configure_logger
from gemseo.api import load_dataset
from gemseo.mlearning.api import create_regression_model
from matplotlib.lines import Line2D
from numpy import nonzero

configure_logger()
<RootLogger root (INFO)>
Load dataset (Burgers)
n_samples = 50
dataset = load_dataset("BurgersDataset", n_samples=n_samples)
inputs = dataset.get_data_by_group(dataset.INPUT_GROUP)
outputs = dataset.get_data_by_group(dataset.OUTPUT_GROUP)
Mixture of experts (MoE)
In this section we load a mixture of experts regression model through the machine learning API, using clustering, classification and regression models.
Mixture of experts model
We construct the MoE model using the predefined parameters, and fit the model to the dataset through the learn() method.
model = create_regression_model("MOERegressor", dataset)
model.set_clusterer("KMeans", n_clusters=2, transformer={"outputs": "JamesonSensor"})
model.set_classifier("KNNClassifier", n_neighbors=3)
model.set_regressor(
    "GaussianProcessRegressor", transformer={"outputs": ("PCA", {"n_components": 20})}
)

model.learn()
/home/docs/checkouts/readthedocs.org/user_builds/gemseo/envs/4.1.0/lib/python3.9/site-packages/sklearn/gaussian_process/_gpr.py:616: ConvergenceWarning: lbfgs failed to converge (status=2):
ABNORMAL_TERMINATION_IN_LNSRCH.

Increase the number of iterations (max_iter) or scale the data as shown in:
    https://scikit-learn.org/stable/modules/preprocessing.html
  _check_optimize_result("lbfgs", opt_res)
Make predictions
predictions = model.predict(inputs)
local_pred_0 = model.predict_local_model(inputs, 0)
local_pred_1 = model.predict_local_model(inputs, 1)
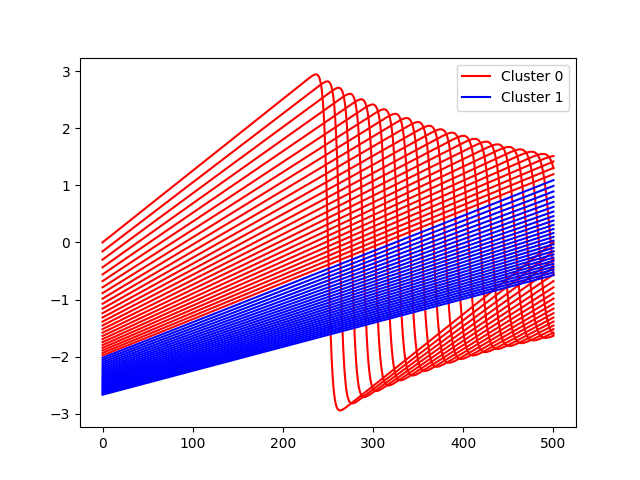
Plot clusters
for i in nonzero(model.clusterer.labels == 0)[0]:
    plt.plot(outputs[i], color="r")
for i in nonzero(model.clusterer.labels == 1)[0]:
    plt.plot(outputs[i], color="b")
plt.legend(
    [Line2D([0], [0], color="r"), Line2D([0], [0], color="b")],
    ["Cluster 0", "Cluster 1"],
)
plt.show()
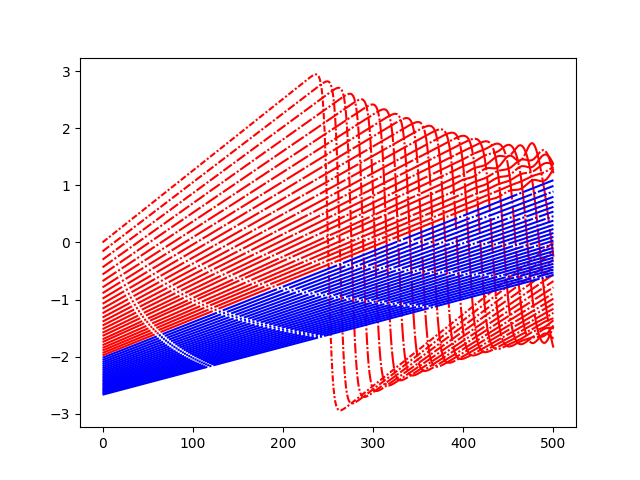
Plot predictions
def lines(i):
    return (0, (i + 3, 1, 1, 1))


for i, pred in enumerate(predictions):
    color = "b"
    if model.labels[i] == 0:
        color = "r"
    plt.plot(pred, color=color, linestyle=lines(i))
plt.show()
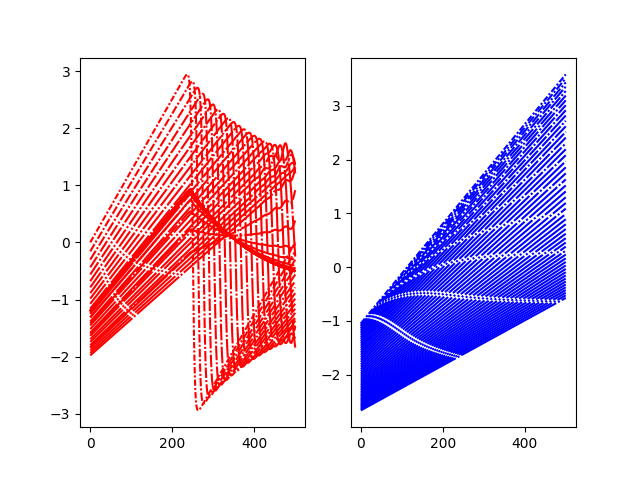
Plot local models
plt.subplot(121)
for i, pred in enumerate(local_pred_0):
    plt.plot(pred, color="r", linestyle=lines(i))
plt.subplot(122)
for i, pred in enumerate(local_pred_1):
    plt.plot(pred, color="b", linestyle=lines(i))
plt.show()
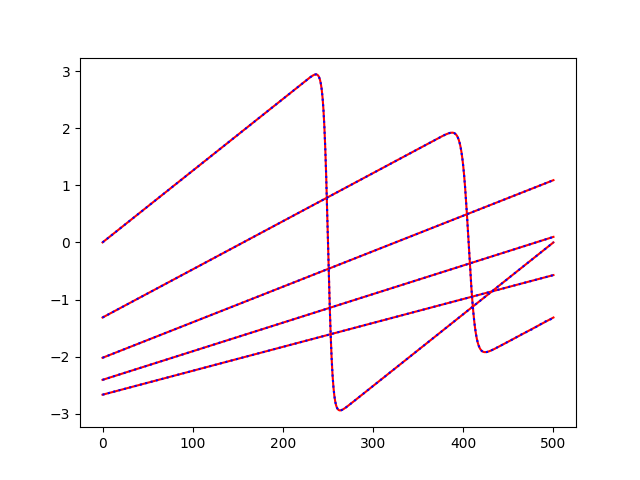
Plot selected predictions and exact curves
for i in [
    0,
    int(dataset.n_samples / 4),
    int(dataset.n_samples * 2 / 4),
    int(dataset.n_samples * 3 / 4),
    -1,
]:
    plt.plot(outputs[i], color="r")
    plt.plot(predictions[i], color="b", linestyle=":")
plt.show()
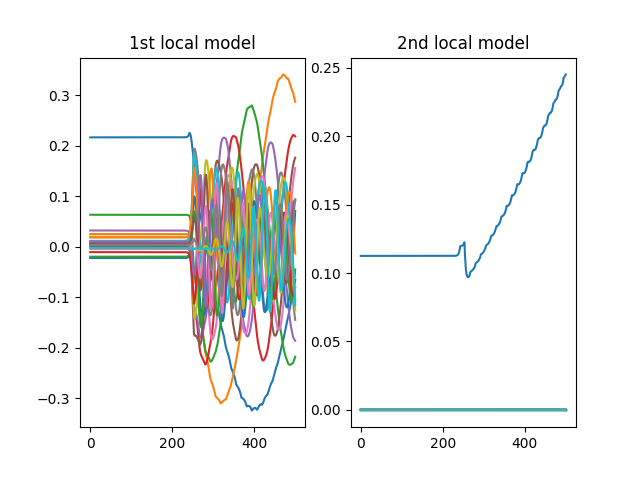
Plot components
local_models = model.regress_models
plt.subplot(121)
plt.plot(local_models[0].transformer["outputs"].components)
plt.title("1st local model")
plt.subplot(122)
plt.plot(local_models[1].transformer["outputs"].components)
plt.title("2nd local model")
plt.show()
Total running time of the script: ( 0 minutes 1.585 seconds)