Note
Go to the end to download the full example code.
Mixture of experts with PCA#
In this demo, we apply a mixture of experts regression model to the Burgers dataset. In order to reduce the output dimension, we apply a PCA to the outputs.
from __future__ import annotations

import matplotlib.pyplot as plt
from matplotlib.lines import Line2D
from numpy import nonzero

from gemseo import create_benchmark_dataset
from gemseo.mlearning import create_regression_model
Load dataset (Burgers)#
n_samples = 50
dataset = create_benchmark_dataset("BurgersDataset", n_samples=n_samples)
inputs = dataset.input_dataset.to_numpy()
outputs = dataset.output_dataset.to_numpy()
Mixture of experts (MoE)#
In this section we load a mixture of experts regression model through the machine learning API, using clustering, classification and regression models.
Mixture of experts model#
We construct the MoE model using the predefined parameters, and fit the model to the dataset through the learn() method.
model = create_regression_model("MOERegressor", dataset)
model.set_clusterer("KMeans", n_clusters=2, transformer={"outputs": "JamesonSensor"})
model.set_classifier("KNNClassifier", n_neighbors=3)
model.set_regressor(
    "GaussianProcessRegressor", transformer={"outputs": ("PCA", {"n_components": 20})}
)

model.learn()
Make predictions#
predictions = model.predict(inputs)
local_pred_0 = model.predict_local_model(inputs, 0)
local_pred_1 = model.predict_local_model(inputs, 1)
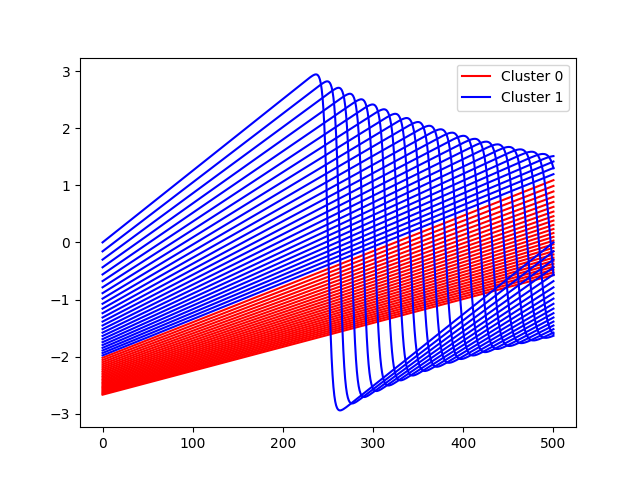
Plot clusters#
for i in nonzero(model.clusterer.labels == 0)[0]:
    plt.plot(outputs[i], color="r")
for i in nonzero(model.clusterer.labels == 1)[0]:
    plt.plot(outputs[i], color="b")
plt.legend(
    [Line2D([0], [0], color="r"), Line2D([0], [0], color="b")],
    ["Cluster 0", "Cluster 1"],
)
plt.show()
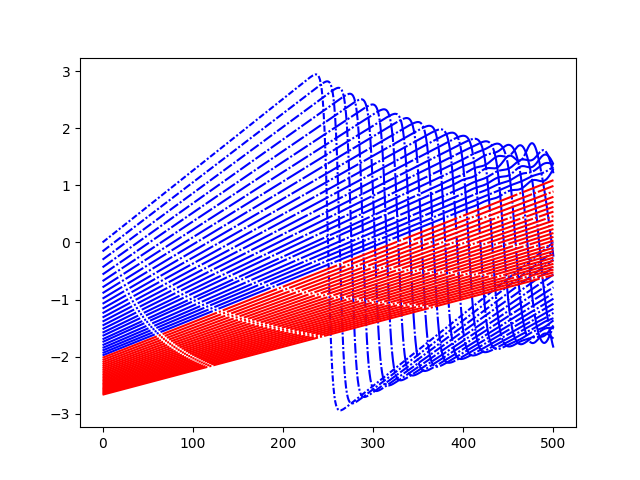
Plot predictions#
def lines(i):
    return 0, (i + 3, 1, 1, 1)


for i, pred in enumerate(predictions):
    color = "b"
    if model.labels[i] == 0:
        color = "r"
    plt.plot(pred, color=color, linestyle=lines(i))
plt.show()
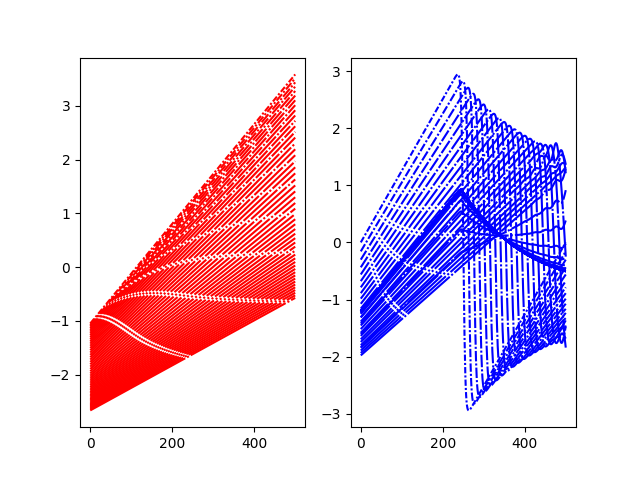
Plot local models#
plt.subplot(121)
for i, pred in enumerate(local_pred_0):
    plt.plot(pred, color="r", linestyle=lines(i))
plt.subplot(122)
for i, pred in enumerate(local_pred_1):
    plt.plot(pred, color="b", linestyle=lines(i))
plt.show()
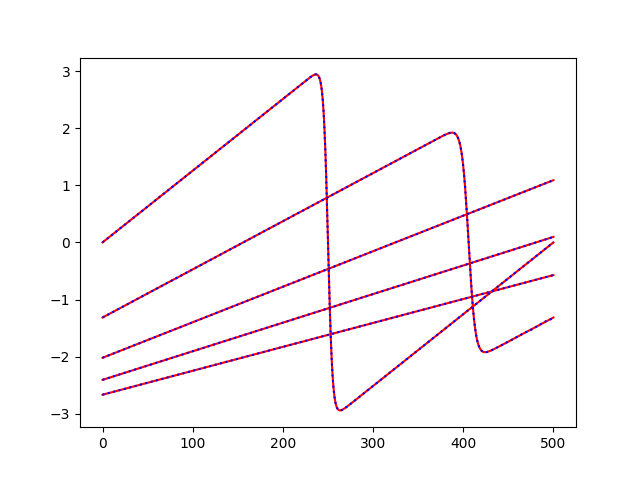
Plot selected predictions and exact curves#
for i in [
    0,
    int(dataset.n_samples / 4),
    int(dataset.n_samples * 2 / 4),
    int(dataset.n_samples * 3 / 4),
    -1,
]:
    plt.plot(outputs[i], color="r")
    plt.plot(predictions[i], color="b", linestyle=":")
plt.show()
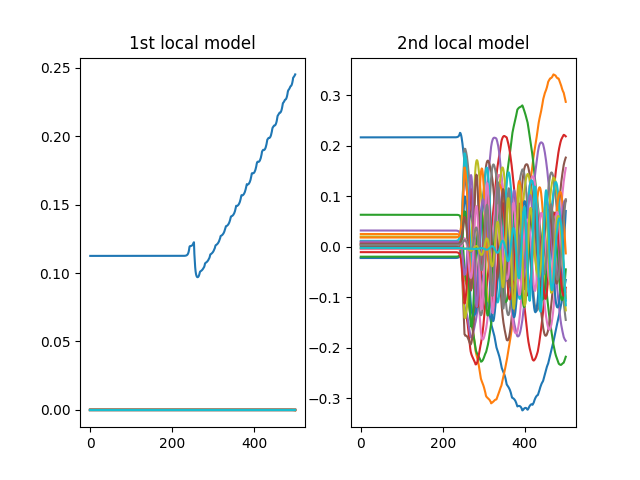
Plot components#
local_models = model.regress_models
plt.subplot(121)
plt.plot(local_models[0].transformer["outputs"].components)
plt.title("1st local model")
plt.subplot(122)
plt.plot(local_models[1].transformer["outputs"].components)
plt.title("2nd local model")
plt.show()
Total running time of the script: (0 minutes 2.673 seconds)