Note
Click here to download the full example code
Boxplot
from __future__ import annotations

from gemseo.api import configure_logger
from gemseo.core.dataset import Dataset
from gemseo.post.dataset.boxplot import Boxplot
from numpy import hstack
from numpy import linspace

configure_logger()
<RootLogger root (INFO)>
Build a dataset
inputs = linspace(-1, 1, 100)[:, None]

dataset = Dataset(name="Foo")
dataset.add_variable("y1", inputs**2, "outputs", cache_as_input=False)
dataset.add_variable(
    "y2", hstack((inputs**3, inputs**4)), "outputs", cache_as_input=False
)

other_dataset = Dataset(name="Bar")
other_dataset.add_variable("y1", -(inputs**2), "outputs", cache_as_input=False)
other_dataset.add_variable(
    "y2", hstack((-(inputs**3), -(inputs**4))), "outputs", cache_as_input=False
)
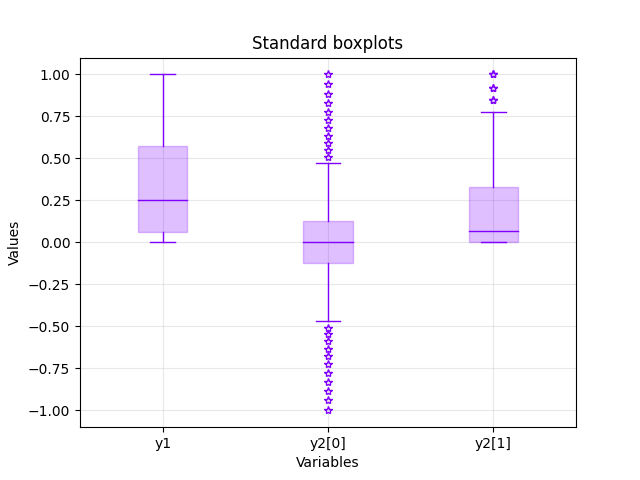
Plot y1 and y2
We can use the Boxplot plot.
plot = Boxplot(dataset)
plot.xlabel = "Variables"
plot.ylabel = "Values"
plot.title = "Standard boxplots"
plot.execute(save=False, show=True)
[<Figure size 640x480 with 1 Axes>]
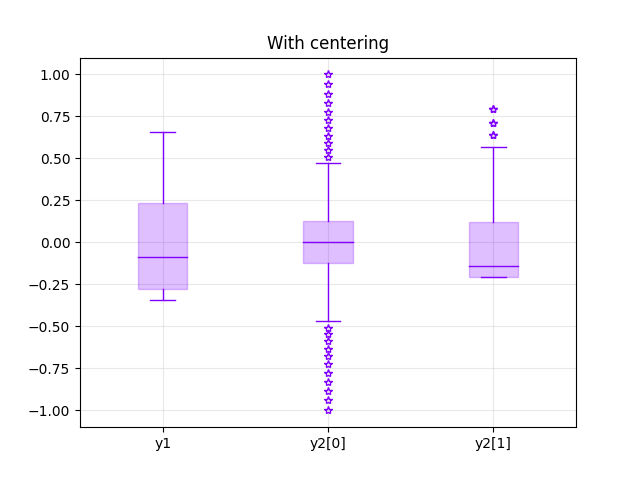
Plot with centering
We can center the data:
plot = Boxplot(dataset, center=True)
plot.title = "With centering"
plot.execute(save=False, show=True)
[<Figure size 640x480 with 1 Axes>]
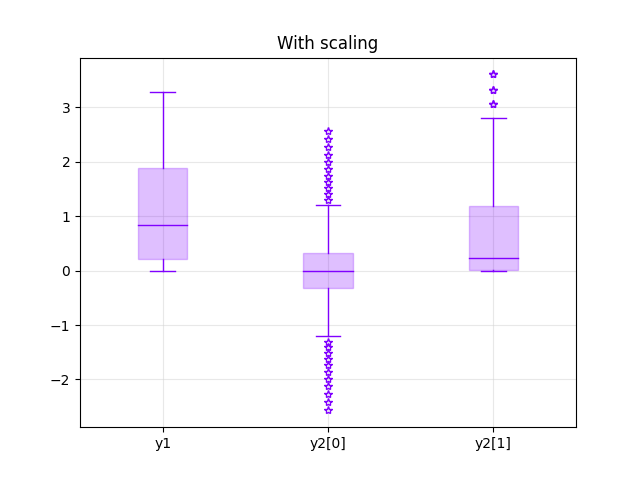
Plot with scaling
We can scale the data (normalization with the standard deviation):
plot = Boxplot(dataset, scale=True)
plot.title = "With scaling"
plot.execute(save=False, show=True)
[<Figure size 640x480 with 1 Axes>]
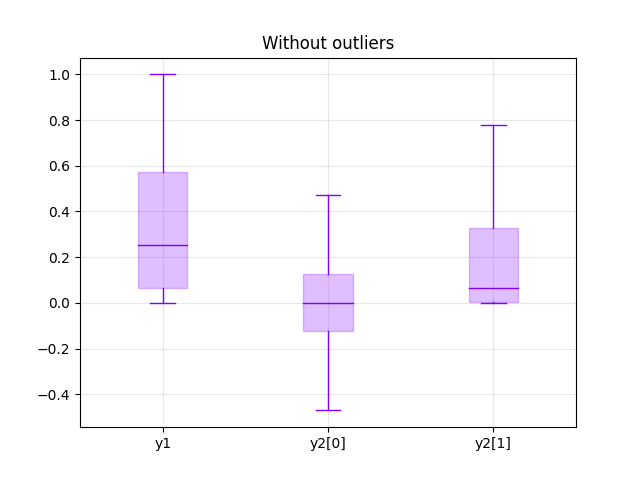
Plot without outliers
We can remove the outliers:
plot = Boxplot(dataset, add_outliers=False)
plot.title = "Without outliers"
plot.execute(save=False, show=True)
[<Figure size 640x480 with 1 Axes>]
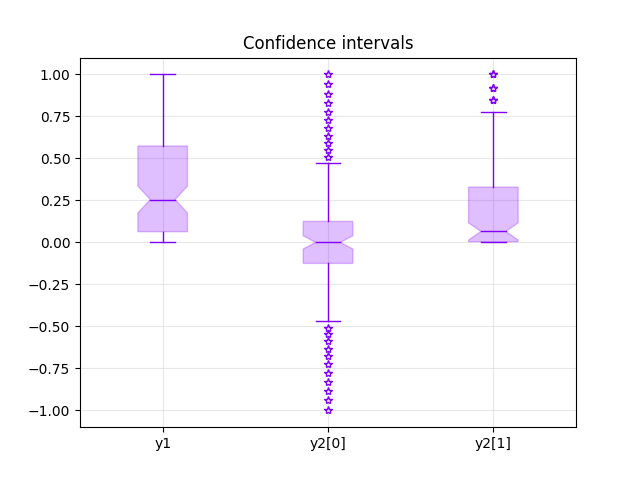
Plot with confidence intervals
We can add confidence intervals for the median:
plot = Boxplot(dataset, add_confidence_interval=True)
plot.title = "Confidence intervals"
plot.execute(save=False, show=True)
[<Figure size 640x480 with 1 Axes>]
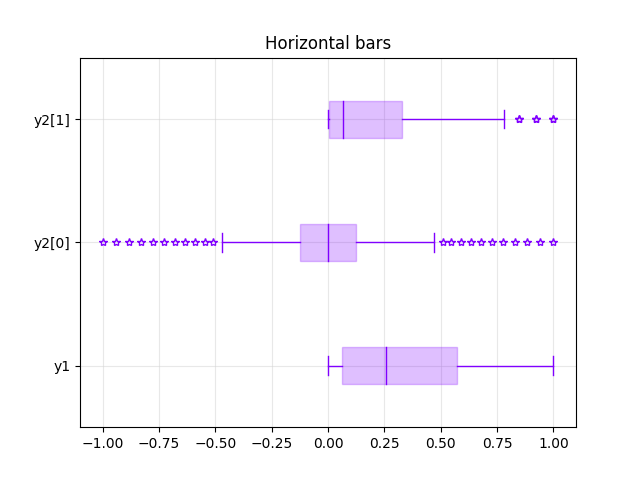
Plot horizontally
We can use horizontal bars:
plot = Boxplot(dataset, use_vertical_bars=False)
plot.title = "Horizontal bars"
plot.execute(save=False, show=True)
[<Figure size 640x480 with 1 Axes>]
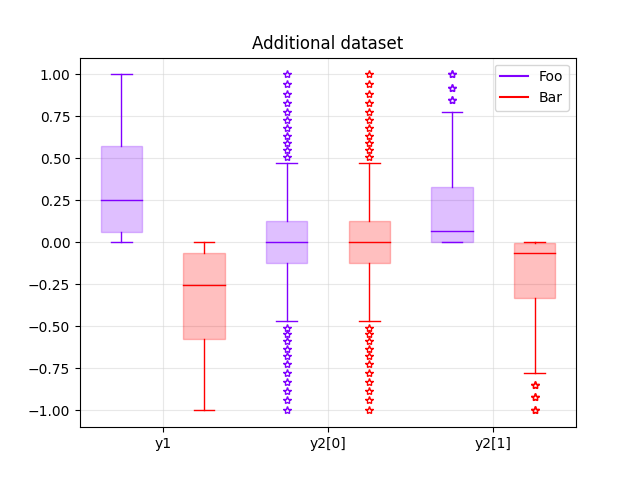
Plot with other datasets
We can add a dataset:
plot = Boxplot(dataset, other_dataset)
plot.title = "Additional dataset"
plot.execute(save=False, show=True)
[<Figure size 640x480 with 1 Axes>]
Total running time of the script: ( 0 minutes 0.975 seconds)